Numerical Weather Prediction Resources
This is a searchable list of online resources that may be useful in courses on NWP or touching upon NWP. This list might include sections of content that are recommended to be converted into stand-alone learning objects.
Browse the glossary using this index
Special | A | B | C | D | E | F | G | H | I | J | K | L | M | N | O | P | Q | R | S | T | U | V | W | X | Y | Z | ALL
C |
|---|
| LP | Cloud Formation Processes | |||
|---|---|---|---|---|
Source: COMET Module, "Influence of Model Physics on NWP Forecasts" Importance of cloud thickness and cloud parameterization processes on model precipitation output.
Additional Resources: | ||||

D |
|---|
| JH | Data Assimilation Process | |||
|---|---|---|---|---|
Source: COMET Module: "Understanding Data Assimilation" Appropriate Level: Some graphics and concepts could be used in introductory classes but the core content is appropriate for upper division majors Outline of Module 1. Data Assimilation Process. A yes/no question that can be skipped 2. Data Assimilation Wizard. Motivation for data assimilation that may appeal to some 3. Data/Observation Increment/Analysis. The core of the module is contained in these three sets of pages. Graphics and simple examples help to highlight critical concepts (a handful of busted links to NCEP operational resources in the Data section). Graphics shown below summarize the components of the data assimilation process. Step 1. Observations received and processed  Step 2. Deviations between the observations and background values are computed  Step 3. Observation increments are used to adjust the background  4. Operational Tips/Juding Analysis Quality. Brief review on some issues associated with assessing analysis quality. 5. Exercise/Assessment. Ordering the steps involved in data assimilation leads to the resulting graphic of the end-to-end process (below).  Other relevant COMET resources: Operational Models Matrix: Brief overviews of operational data assimilation systems are listed at the bottom. Good Data/Poor Analysis Case Study: Very nice illustration of some of the issues associated with objective analysis/data assimilation. WRF Model WebCast: Provides very useful information on the Gridded Statistical Interpolation (GSI) assimilation approach used in the NCEP NAM. | ||||
E |
|---|
| JH | ECMWF Training on Data Assimilation | |||
|---|---|---|---|---|
Source: ECMWF Training Material Level: Instructor Technical information on data assimilation as applied at the ECMWF. | ||||
| JH | Ensemble Filters | |||
|---|---|---|---|---|
COMET Module: None on this subject yet Appropriate Level: Graduate level Ensemble Filters for Geophysical Data Assimilation: A Tutorial by Jeff Anderson. Data Assimilation Research Testbed This is an excellent, but technical, introduction to ensemble modeling. | ||||
Ensemble Forecasting | ||||
|---|---|---|---|---|
COMET Module: "Ensemble Forecasting Explained" (2004) "The assumptions made in constructing ensemble forecast systems (EPS) and the intelligent use of their output will be the primary focus of this module. In order for you to better understand EPS output, we will also look at some necessary background information on statistics, probability, and probabilistic forecasting." Appropriate Level: Advanced undergraduate and above. Summary comments: Lots of text, some of which can be dense (when the concepts described are relatively challenging). Simple, mostly static diagrams provide clear illustrations. Assessment exercises (multiple choice and multiple answer questions, with feedback) help. Quite a few ensemble forecast products and verification tools are described. Basic concepts of probability and statistics underly most of these (as befits the topic), and an attempt is made to provide some background about these, but a basic statistics course would be a valuable prerequisite to this material. A COMET webcast by NCEP's Dr. Bill Bua offers a simpler, one-hour introduction to a subset of the material in this module, "Introduction to Ensemble Prediction"; for most users unfamiliar with ensemble forecasting, I recommend viewing the webcast before completing the module. Preassessment. This module starts with a randomized, 15-item pre-assessment quiz, which the user repeats at the end of the module as a measure of what the user has learned. The pre-assessment quiz therefore should provide a preview of at least some of the module's content. The mostly (entirely?) multiple-answer quiz questions include graph and weather map interpretations and verbal questions about aspects of ensemble forecasting and its applications. The questions, graphs and maps--and hence necessarily the module itself--use language and invoke concepts technical enough to be well out of the reach of beginning students. Here's an example of a graph with very limited explanation offered to help the user interpret it (which of course is the point--the user presumably will learn more about it in the module):  (The user is asked about the resolution and reliability of the two forecasts depicted in the graph.) Depending on the degree of support provided by the instructor and the module itself, the preassessment suggests that upper division majors should be able to learn something from the module. Taking the preassessment quiz yourself is one way of judging whether the module content as it stands is appropriate in content and level for your students. Warning: although the preassessment strikes me as a useful pedagogical tool (for measuring learning progress and offering a preview of the module content), completing it can be discouraging unless users understand that they aren't expected to do well on it and that they should look forward to learning enough from the module to improve dramatically. Introduction.
| ||||
Ensemble Forecasting: Information Matrix (NCEP) | ||||
|---|---|---|---|---|
COMET Module: "Ensemble Prediction System Matrix: Characterics of Operational Ensemble Prediction Systems (EPS)" (updated as needed) "This matrix describes the operational configuration of NCEP EPS, including the method of perturbing the forecasts (initial condition or model), the configuration(s) of the model(s) used in the EPS, and other operationall significant matters." Appropriate level: Advanced undergraduate and above. Summary comments: This module is not an instructional module but is rather a matrix of hypertext links to information about aspects of NCEP's medium range and short range ensemble forecasting systems, including perturbation methods, characteristics of the models used, and postprocessing and verification. Some of the informational Web pages are illustrated with simple, clear diagrams, and some links lead to the "Ensemble Forecasting Explained" module (see entry in this glossary under "Ensemble Forecasting"). For students already familiar with the basics of how numerical weather prediction systems work and how numerical models are formulated, the matrix provides a useful way to investigate these topics in more detail, at least for NCEP's ensemble forecasting system. Some explanations are illustratrated with clear and easy to read, albeit static, graphics. Instructors might find some of these explanatory Web pages useful for instructional purposes, such as assigned reading. | ||||
Ensemble Forecasting: Webcast Introduction | ||||
|---|---|---|---|---|
COMET Webcast: "Introduction to Ensemble Prediction" (2005) This one-hour webcast by NCEP's William Bua "introduce[s] concepts in the COMET module Ensemble Forecasting Explained" (see the glossary entry for the module). Appropriate level: Advanced undergraduates and above. Summary comments: Dr. Bua's webcast presents a subset of the concepts presented in the Ensemble Forecasting Explained module. Generally speaking, the webcast treats its topics more simply than the module does. Quizzes with feedback, including a preassessment, are interspersed throughout. Viewing the webcast first should make completing the module, which is text intensive and sometimes conceptually challenging, easier. | ||||
F |
|---|

G |
|---|
| JH | Gridded Statistical Interpolation | |||
|---|---|---|---|---|
COMET Module: Technique mentioned only in passing Level: Graduate level Journal article (Wu et al. 2002 MWR) that provides a technical description of selected aspects of the gridded statistical interpolation used in the NCEP GFS model. A version of this 3-dimensional variational approach is also used in the 2-D real time mesoscale analysis (RTMA). | ||||
I |
|---|
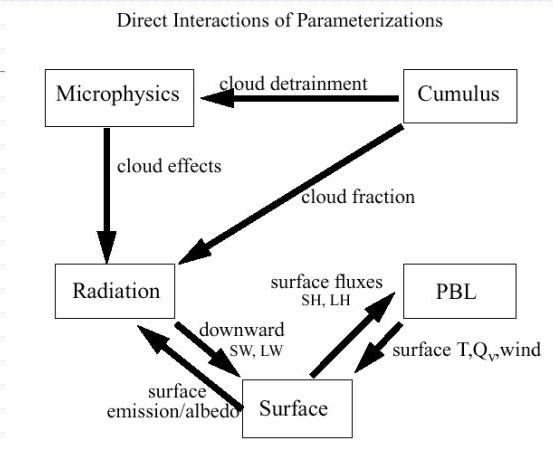
| SC | Interactions of Parameterizations | |||
|---|---|---|---|---|
Module: Influence of Model Physics on NWP Forecasts
| ||||