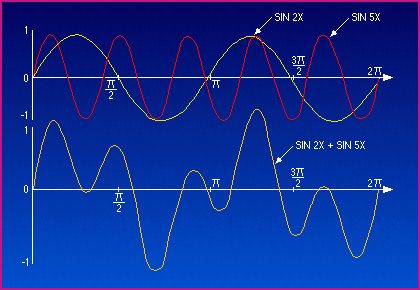
A concept that is difficult to get across is how a seeming random wave can be deconstructed into a series of sine waves.
The image below is a little old, but gives a great visual of the process:

For the 'mark 2' version, I envision an applet that looks like this, but has, perhaps, 4 different lines. The top 2 lines would be sin(x) and cos(x) on the top line (much like the sin(2x) and sin(5x) on the top line of the above image), sin(2x) and cos(2x) on the second line. The third would be the sum of the four waves above, similar to the bottom line on the above image.
Each of the top 4 waves would have an 'amplitude slider', where one could alter the amplitude of each of the waves. For instance, if one set the amplitude of 'sin(x)' to 1, and all the other waves (cos(x), sin(2x), cos(2x))to 0, one would get that same sine wave back on the bottom panel. By changing the amplitude of the 4 waves above, one can create increasingly complex patterns on the sum of the 4. I believe that the slider will need to be discretized, perhaps in increments of 0.25, to keep the number of possiblities low.
To make this even more interactive, on the bottom (4th) line, would beith some sort of pre-determinied structure. The goal would then be for the user to manipulate the amplitudes of the top 4 waves (sin(x), sin(2x), cos(x), cos(2x)) until the sum of those 4 waves matched the 4th line. We could have a 'easy', 'moderate', and 'hard' option on this 4th line, with the easy being something like sin(x)+0.5*cos(x), and the 'hard' being a combination of all four above waves.
The 'hard' one would try to match up with the observed longwave structure evidenced in the "Model Structure and Dynamics" module.

Thus, the 'hard' option of the three waves to try to match would be something resembling the wave in the above image. That might be hard to pull off with only 4 waves, but the motivation would be to show that a combination of something they can visualize (sin and cos) can represent the real, complicated, atmospheric flow field.

