Radar Meteorology Glossary
This glossary will be the main reference for radar products and problems and will give details on what the different products are and how they are used.
Browse the glossary using this index
Special | A | B | C | D | E | F | G | H | I | J | K | L | M | N | O | P | Q | R | S | T | U | V | W | X | Y | Z | ALL
V |
|---|
VADThe VAD (Velocity Azimuth Display) technique is used to retrieve the vertical wind profile at the radar site with a Doppler radar. PPI scans at an elevation of about 20° cover various heights with one scan. | ||
Velocity AliasingAmbiguous detection of radial velocities outside the Nyquist Interval by Doppler Radar. | |
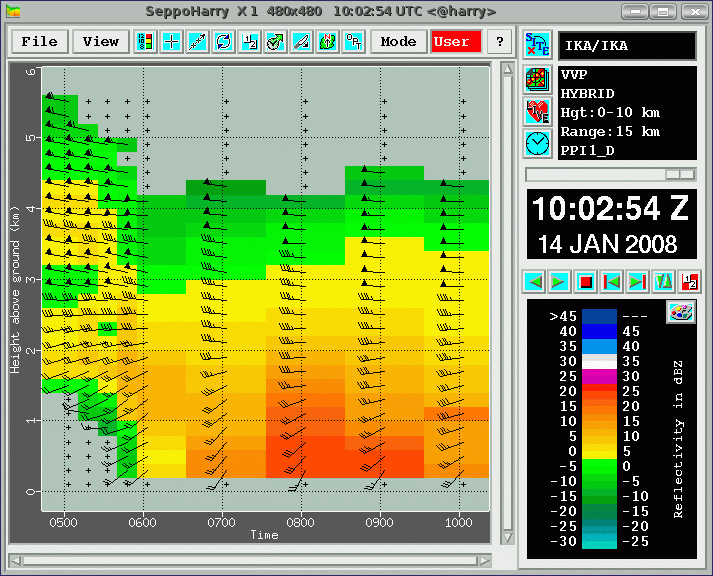
Vertical wind profileDescriptionRadar product with the vertical profile of the wind estimated from Doppler measurements above the weather radar station. For each height level this product gives a set of parameters describing the wind field. ParametersVertical spacing: height difference between successive samples in mVertical range: range of considered altitudes (lowest, upper) in 0.1 km a.s.l. Volume shape: Cylindrical, Conical, ... Quality information: (OK or suspect or not-applicable or missing) Product data quantity for each height level: horizontal and vertical velocity in 0.1 m/s and direction in degrees Notes• Detailed information is present in documents OPERA 22-1/99 and 22-2/99. "• When the vertical stratification is not regular the sequence of the used heights is to be specified. " • The volume shape can optionally be omitted. Example Image | ||
Vertically Integrated LiquidDescription2D map containing the integrated liquid water content between set upper and lower limits in altitude in the vertical column over each surface point. ParametersProduct data quantity: W (intergrated liquid water content)Unit: mm Upper limit altitude: km Lower limit altitude: km Z/W relationship used Optional: height of melting layer Image size: number of pixels per row (# of columns) and per column (# of rows) Pixel size: horizontal and vertical extension of the pixel in km Level slicing method: list of values or formula parameters (see section 7) Level slicing unit: mm Notes• Z/W relationships are different for snow and water• The bright band biases VIL results, so the top and bottom should be either above or below melting layer altitude. | ||
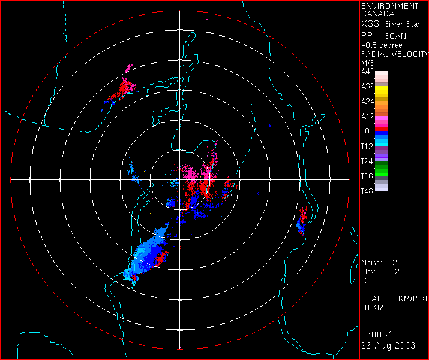
Volcanic ashProblems caused to radar productsVolcanic ash has different dielectric characteristics from liquid water and ice but ash and soot from forest fires and/or volcanic eruptions can still be detected by weather radars.Example Image  | ||
Volume ScanThe process of completing a series of antenna rotations at specified elevation angles. | |
