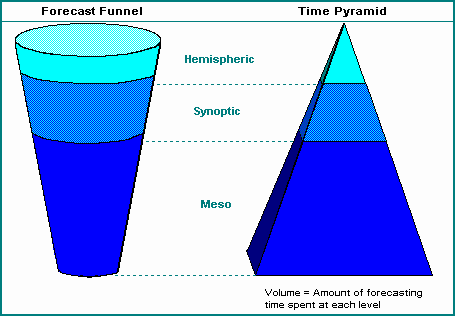
Synoptic and Mesoscale Forecast Funnel
Synoptic and Mesoscale Model Group
Our objective was to develop a template for an effective map discussion that might be given, for example, in an introductory level synoptic or mesoscale meteorology course.
Of course, the contents (ie, maps, graphics) of an effective map discussion depend on season, day, time of day, area of interest, current weather situation, plus how much time is available and who is giving the map discussion (and certainly other factors as well). Thus, in many ways, our template is arbitrary. Still, there are common elements to most map discussions, and we have tried to stick to what our group members believe is a reasonable set of elements that would be appropriate in an introductory synoptic (or mesoscale) meteorology course.
Helpful tips will be given with each graphic, indicating the key features that should be gleaned from that graphic these might include, for example, prominent long-range ridges and troughs, jet streaks, areas of significant temperature and vorticity advection, or low-level jets. Links will also be provided to other web sites (some COMET, perhaps) where additional information can be found about the information on a particular graphic (for example, how to interpret a water vapor satellite image). In addition, in places where students should hand-analyze the situation (perhaps a surface maps of station models at the mesoscale), links to maps of the raw data will be provided so that students can get their feet wet.
Ultimately, we envision a COMET module that provides a one stop shop that a student can use as a tool to determine what standard maps (both analysis and forecast), imagery, etc., professional meteorologists use on a daily basis. This module would be modeled after the new skew-t module under development except it would encompass information on how to use and interpret standard map products.
Forecast Funnel

Important tools/discussions students should examine before progressing:
- "Forecast Funnel" Web-based Module (after COMET Forecast Processes module)
- Getting your hands dirty with the data ...
Students: Before discussing each image, please indicate time of analysis/prog and what variables are illustrated.
Hemispheric (Northwestern Hesmiphere)
- 500 mb Heights and Anomalies (left panel, previous 5 day animation); reveals large-scale features and how those features are related to the climatology at that time
- Examine Long-wave troughs and ridges and their movement
- Take special note of number of waves and location of axes
- Is the pattern rapidly changing or static?
- 300 mb Jet Stream Analysis (alt) - latest Eta/GFS analysis of isotachs
- Examine jet stream configuration. Meridional?
- Subtropical jet visible?
- Where are the jet cores/regions of strongest jet?
- Water Vapor Imagery (alt) - 24 hr loop of previous, composite images; 6.7 micron band examining mid/upper tropospheric moisture
- Examine moist/dry regions and relate to large-scale features found on 500 and 300 mb charts
- Pay close attention to areas of discontinuity.
- Can you determine the polar jet stream location? Also, is a subtropical jet visible?
- 300 mb Heights/Isotachs/Wind Vectors (latest ADAS analysis) more information on this chart
- Structure and placement of jet streak in relation to height field.
- Based on simple models of jet streak structure, where can we expect areas of convergence/divergence?
- 500 mb Heights/Absolute Vorticity (latest ADAS analysis) more information on this chart
- Examine large-scale trough/ridge configuration
- In addition, examine and focus on more subtle shortwave troughs/ridges
- How do shortwaves relate to vorticity maxima/minima and their advections
- How can we examine component(s) of QG forcing? What regions may we suspect large-scale forcing for upward motion?
- Low-level Moisture
- 850 mb Heights/Theta-e/Isotachs (latest WRF analysis); Theta-e combines heat and moisture into a single parameter
- Note "noses"/maximums/gradients/fetches
- Frontal locations?
- Lifted Index/Surface Dewpoints (latest WRF analysis)
- How does instability relate to moisture?
- Examine maximums/gradients/fetches
- Frontal locations?
- 1000-500 mb Thickness/Sea-level Pressure (latest WRF analysis) more information on this chart
- Find highs and lows.
- Evaluate low-level thermal advection -- focus on solenoids. How does this relate to QG theory?
- Thicknesses and temperatures/precipitation types.
- Remote Sensing Data (more information)
- IR (Visible) has better temporal (spatial) resolution
- Examine system evolution
- Importance of cloud cover and differential heating/stability.
- IR - note cloud top temperatures/trends
- Composite Base Reflectivity (latest 1-2 hr loop)
- Additional links (if time permits)
- 500 mb heights and water vapor loop (24 hr)
- relate features found on water vapor with height field
- 700 mb Heights/Vertical Velocity (latest WRF analysis) more information on this chart
- Upward motion (and downward motion) is what it's all about.
- Lifted Index/CAPE (latest ADAS analysis)
- Regions of instability (negative LI or CAPEs greater than 1000 (seasonal))
- Parcel considerations and updraft/downdraft strength and relation to severe convection
Mesoscale
- Surface Plot; illustrates temperature and moisture boundaries; areas of surface convergence
- Examine frontal boundary positions and their movement using a hand-drawn analysis
- Examine regions of surface convergence
- Visible / IR Satellite Imagery (loop)
- Examine boundaries, cumulus development
- Radar;
- Examine trends (intensity and movement)
Cold Season
- 850 mb Isotherms / Heights / Wind Vectors
Nose of LLJ
Advection of warm, moist air
Determine precipitation type
- Examine areas where banded precipitation may occur
Warm Season
- Determine convective initiation areas
- Determine areas of instability
- Determine convective organization (e.g, single, multicell, supercell)
Modifié le: mardi 18 septembre 2012, 08:38