Sidelobes
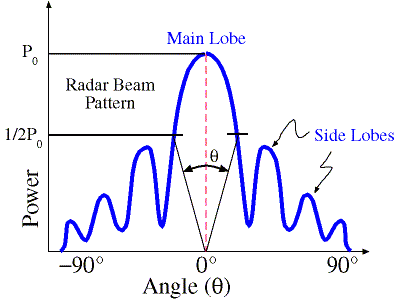
 A radar antenna focuses transmitted energy in a narrow, conical-shaped beam (see Figure 1). The angular width of the radar beam is defined as that region of transmitted energy that is bounded by one-half (-3 dB) the maximum power. Around 80% of the energy is contained within the main beam, with the sidelobes generally being more than 1000 times less intense in a high quality antenna (unlike in the p-theta graph).

Up↑
Right →
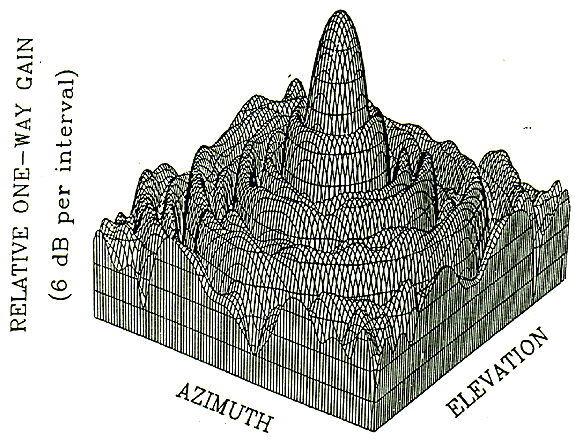
Figure 2. Distribution of power with azimuth and elevation angles
The maximum power lies along the beam center-line and decreases outward. Note that the pattern is actually 3 dimensional (see Figure 2). Note that the beamwidth is proportional to the wavelength, but inversely proportional to the antenna diameter. This means that a one degree beamwidth C band radar will have an antenna half the diameter of an S-band radar of a similar beamwidth. Similarly even though an S band radar may have the same antenna diameter as a C band radar, its beamwidth will be twice as much. Ideally we want a radar with a small beamwidth and sidelobes very much below the main lobe. That means that an antenna built to high quality specifications (ie as close to parabolic as possible), with a narrow beamwidth for better resolution is desired. The cost of a radar is largely driven by the size of its antenna; the bigger the antenna, the bigger the cost due to the more robust the gears, the bigger the radome etc etc.
Due to diffraction experienced by the electromagnetic energy at the edge of the parabolic reflector, only about 80 percent of the energy broadcast by a weather radar is contained in the half-power radar beam. Most of the remaining 20 percent is broadcast in other directions (some energy outside the half-power points also travels in the direction the antenna is pointing).

Figure 3. Directional power density pattern
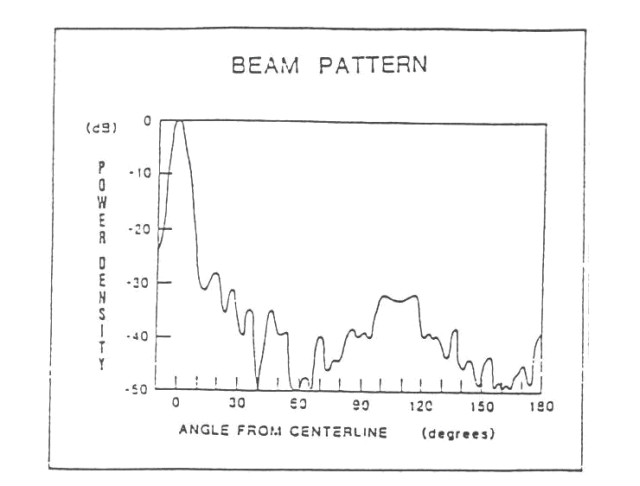
Nearly all the energy not contained in the half-power beam tends to travel in these other preferred directions, as shown in Figure 4, and comprises the side lobes, which are presently an unavoidable and detrimental part of any weather radar system.

Figure 4. Power density as a function of the angle of the antenna from the centerline
Since the radar beam is three-dimensional, the side lobe pattern is also. Again, the pattern in the vertical for a weather radar with a parabolic reflector would be as indicated in Figure 4, but with angles form the center-line measured vertically.
Since side lobes contain much lower power densities than the half-power radar beam, the great majority of “side-effects” occur at close range. Since energy returned to the receiver produces a displayed target in the pointing direction of the antenna, side lobe return can produce multiple displays of the same target (usually only at close range). Side lobe return accounts for the solid character of the display pattern from non-precipitating targets at close range, usually called ground clutter. This, of course, makes it very difficult at times to separate precipitation from non-weather targets within the ground clutter pattern. Predictable, unique ground clutter patterns exist for each radar site.