Signal v. Noise

In order for the returned signal from a precipitation target to be detected by radar, it must contain more power than the noise. Noise is any unwanted electrical disturbance or spurious signal, which may come from internal or external sources measured in the receiver. 

External noise has contributions from several sources. Radiation from space (cosmic) and from oxygen and water vapour molecules in the atmosphere, though attenuated somewhat by the radome, duplexer and waveguide, arrives at the receiver input. (Note that these components attenuate a small portion of noise, so they must also attenuate a small portion of the signal.)

Noise generated by the radar system itself is referred to as internal noise and may come from the waveguide between antenna and receiver, the radome, and the duplexer. The receiver itself is the chief source of internal electronic noise – it adds noise to the signal it amplifies (Doviak and Zrnic, 1984).

Internal sources of noise can be controlled to some degree, but external sources of noise are more difficult to eliminate. Incoming signals from precipitation targets, as previously mentioned, must exceed the noise level at the receiver output. The smallest incoming signal that will produce a discernible signal at the output is referred to as the minimum discernible signal (mds).

Minimum Discernible Signal – the smallest signal returned to a radar unit that can be detected by an operator
The lower the internal noise level, the lower the mds and the greater the sensitivity of the radar. Therefore, radar receivers are designed to have the lowest possible mds. Since signal power from light precipitation can be as low as 2×10-14, receivers are designed to have a mds of 10-13 to 10-14 watt.
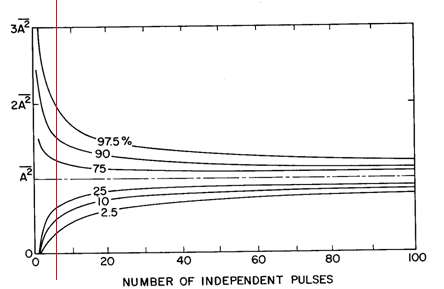
To reduce noise in reflectivity, we need several “independent” samples, ie where subsequent samples are not correlated. To keep reflectivity errors within acceptable limits, at least 6 independent pulses per range/azimuth bin are required.

Number of independent values of A2 needed to yield an estimated A2 having n value within predetermined limits of the true A2. The 90 percent curve, for instance, indicates that 90 percent of the averages of 50 independent values of signal intensity (A2) may be expected to fall below 1.1752

In the diagram above, signal intensity (A2) is plotted against the number of independent measurements of intensity needed to obtain measurements of intensity within the desired accuracy (in %).

As an example, to be in error less than a factor 2 (ie within 3dBZ of the actual intensity) 97.5% of the time, 6 independent pulses are required. You can see this in the diagram where the red line intersects the 97.5% curve at 2A2 (factor of two error on the intensity estimate).

Studies have also shown that the time for rain particles to re-arrange to be “independent” is ~ 10-2 sec. So, to get 6 independent samples, need to scan for at least 0.06 sec along each radial.

This in turn implies a maximum of 20º/s rotation speed with a minimum pulse repetition frequency (PRF) of 100Hz. Doppler radars will operate at higher PRFs in order to optimise velocity measurement ability. So why is this important?? This factor sets the upper limit on rotation speed of radar antennae, and thus the minimum time in which to collect a full “volume scan”.