CAPPI
The Constant Altitude Plan Position Indicator (CAPPI) gives a horizontal cross-section of data at constant altitude. It was developed by researchers at McGill University in Montreal by the Stormy Weather Group[1] to circumvent some problems with the PPI:
-
Altitude changing with distance to the radar.
-
Ground echoes problems near the radar.
CAPPI is the most extensively used display on weather radars, and usually used for compositing data from several radars.
Lines of constant altitude (dashed) corrected for the earth's
curvature and normal refraction plotted against range. Diagram
illustrates how a CAPPI is obtained.
The Constant Altitude Plan Position Indicator (CAPPI) is a two dimensional
areal representation extracted from three dimensional volume scan data.
A horizontal slice is taken through the data at constant height. Since
the Earth is curved and the minimum elevation angle is about 0.5°, beyond
a certain range (~ 100km) the radar data will all be above the selected altitude
for low CAPPI altitudes of say 1 to 3 km. Since, the CAPPI is generated
by using the nearest range bin to the selected height, for low altitudes, at
far ranges, the data is taken from the lowest elevation angle and therefore
as the range increases, the height of the data increases. Conversely,
at near ranges to the radar (<~40 km), most of the data is from below the
selected height, the data is taken from the highest elevation angle and again
the data increases with height for increasing range.
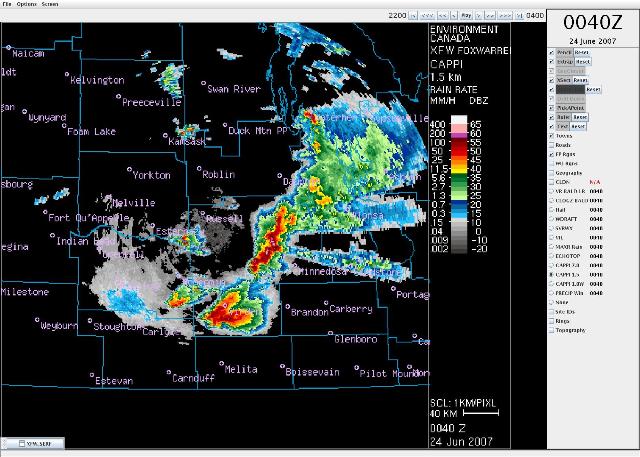
1.5 km CAPPI image.
[1]: See website below