Melting Layer Overlay
How many times have you been fooled by strong echoes approaching the radar that weaken and don't give much precipitation? Consider the animation below.
1.5 km CAPPI from the Woodlands (northwest of Winnipeg) radar.
and the associated 12-hour rainfall accumulation below.
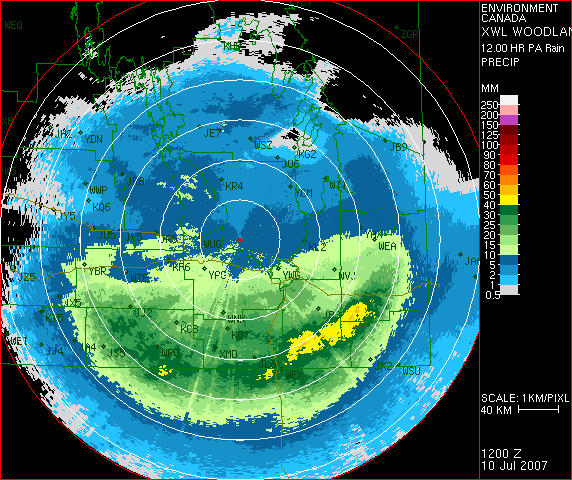
12-Hour rainfall amounts from 00Z to 12Z July 10, 2007. Note the orange pixels (50+ mm) embedded in the yellow area to the southeast of Winnipeg.
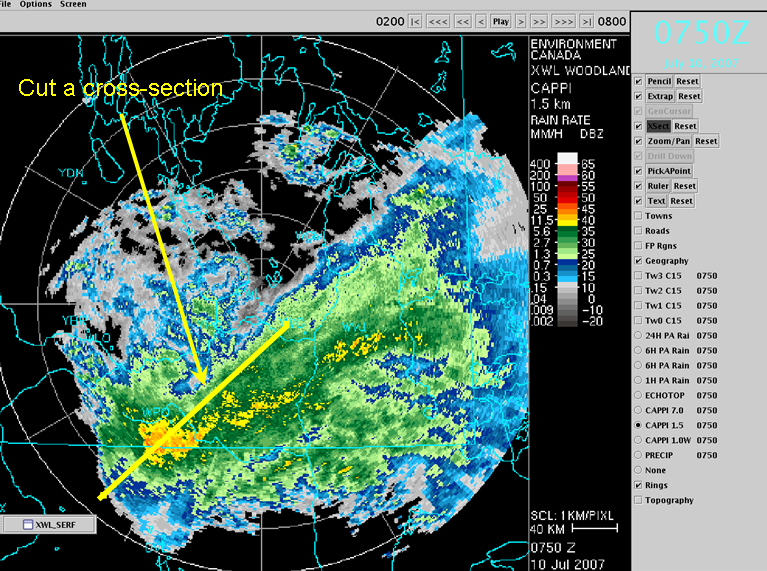
Cut a cross-section through the image at 0750Z.
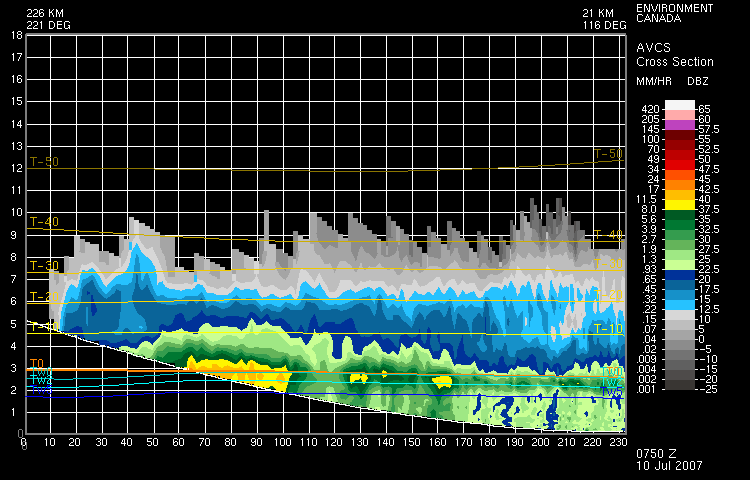
Resulting cross-section. The melting-zone bright band in near Tw = 2°C.
The melting layer overlay, with Tw = 3°C, is plotted over the CAPPI image showing echoes associated with the melting-layer bright band.