Cell Identification
n
n
The ability of an algorithm to identify a cluster of echoes as a discrete cell is crucial because everything from storm tracking to wind algorithms depends on it. If the algorithm identifies a host of fictitious "cells" not only is the radar display more cluttered, but extra computer processing is required to try to track them.
Some definitions are necessary, specifically the differences between cells and thunderstorms.
nThunderstorms often consist of multiple cells. The URP definition of a cell is different and assumes a larger scale than the average thunderstorm. It is designed to identify thunderstorm complexes.
Current URP storm cell identification uses the 45 dBZ MaxR covering at least 4 radar bins (≥ 2 bins in azimuth × ≥ 2 bins vertically), but does not account for AP. The algorithm tends to get overly excited close to the radar because of the smaller bin size and the 2×2 bin area.
A new prototype cell identification algorithm keys on a core reflectivity threshold enclosing a minimum volume, with a certain minimum subset volume being colder than a given threshold temperature, -10C. By configuring a minimum "cold" volume and a minimum allowed feature top, AP "cells" can be minimized, though not completely removed.
2008/2009 Test Configuration
- core dBZ threshold: 45 dBZ
- core minimum volume: 50 km3
- 2008 cold temperature threshold: 0C
- 2008 cold minimum volume: 10 km3
- 2009 cold temperature threshold: -20C
- 2009 cold minimum volume: 5 km3
- minimum allowed feature top: 2.0 km
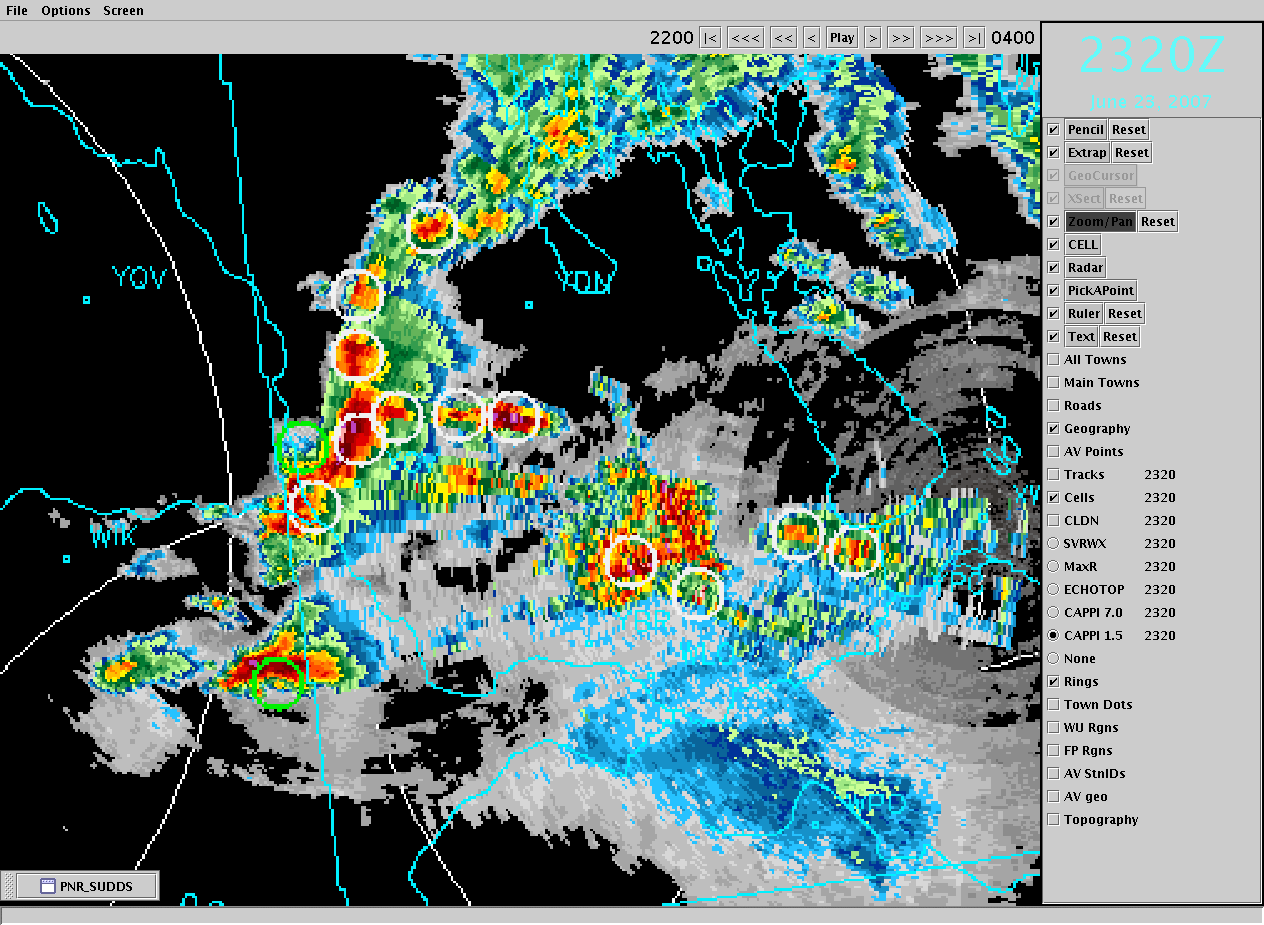
1.5 km CAPPI reflectivity image heavily contaminated by AP. White circles are where URP identified cells. About an hour and a half after this image, the Pipestone F3 tornado touched down.

The same image as above, this one showing just the storm cells.

The same image, with the new cell identification algorithm implemented. Note that the number of cells identified has dropped sharply.
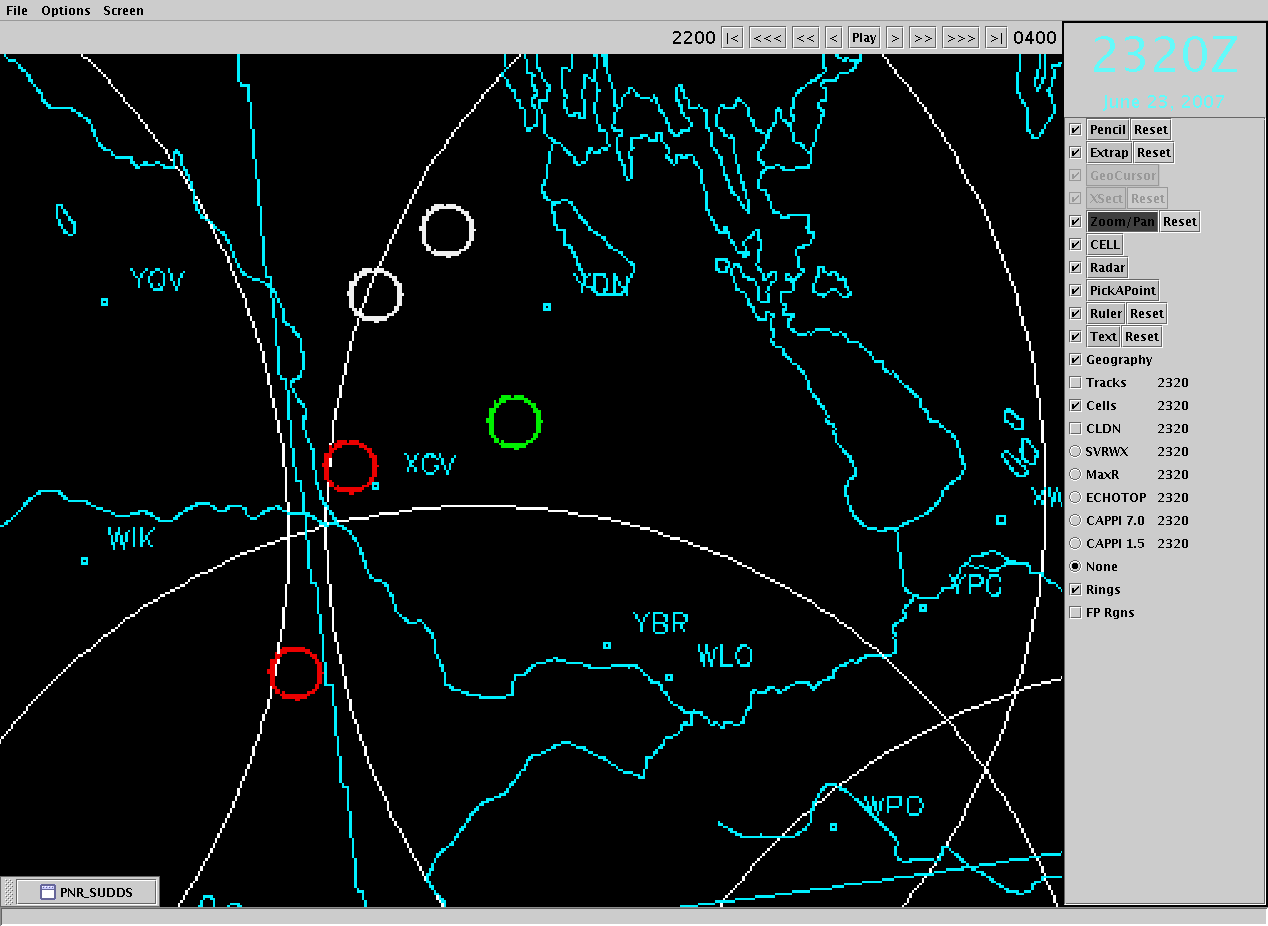
Instead of identifying 14 cells, only 5 have been identified. The remaining 9 "cells" were fictitious, produced by the AP contaminating the scene.
n
Even with a -20c temperature threshold and a cold volume ≥ 5 km3, AP was not always eliminated. If you look at radar cell AP characteristics in terms of:
- texture: the mean-squared dBZ difference between adjacent radial bins
- spin: percentage of adjacent radial bins that display gradient sign
and use model GRIB data (15 levels available every 3 hours) to assess values of MUCAPE, you can't always discriminate between real cells and fictitious AP "cells".
Attempts are being made to nowcast the beam height and identify AP in real time, but the results have been mixed. How this is being done is beyond the scope of this course.
NMn
n
¡