Validation
•
Validation of the new algorithm to place during the summer of 2008, using three approaches:
-
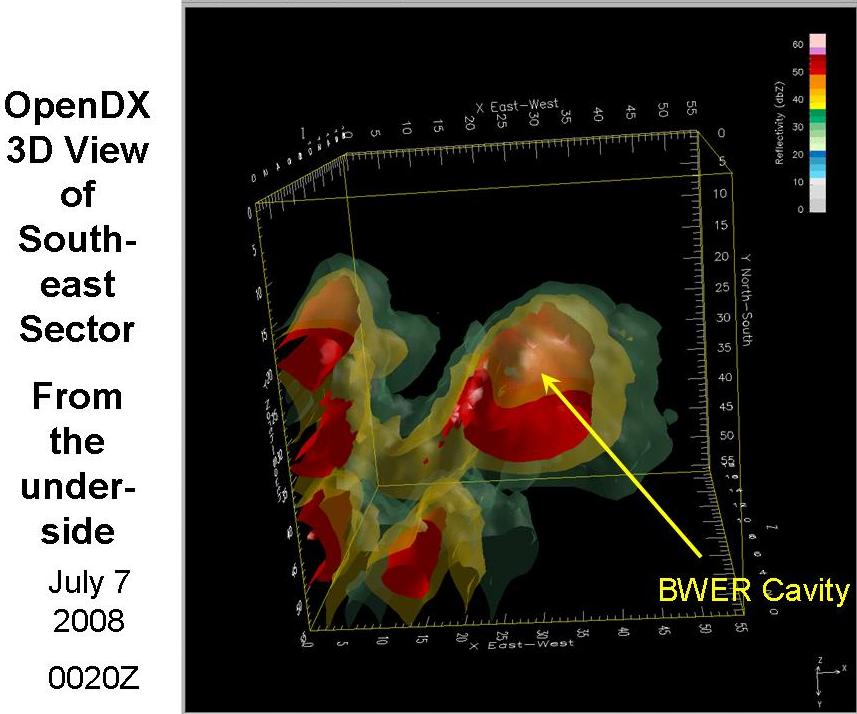
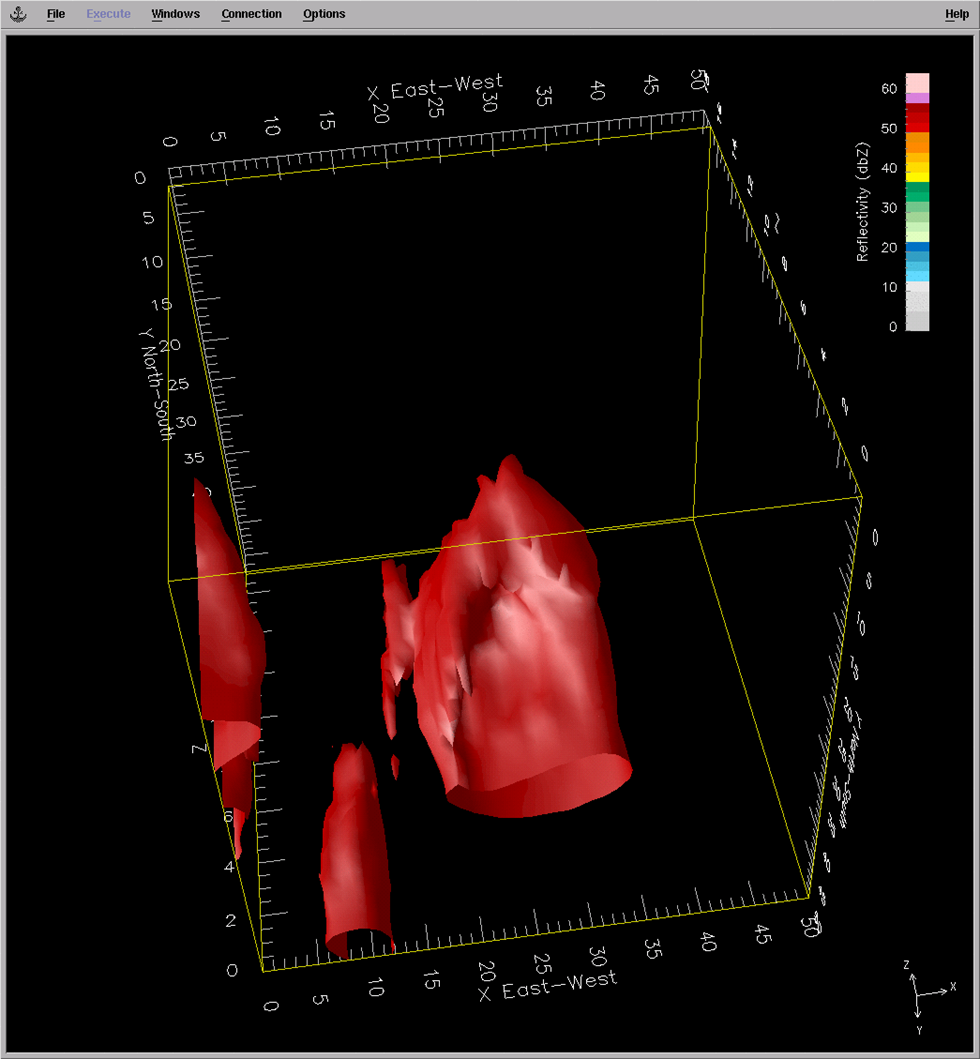
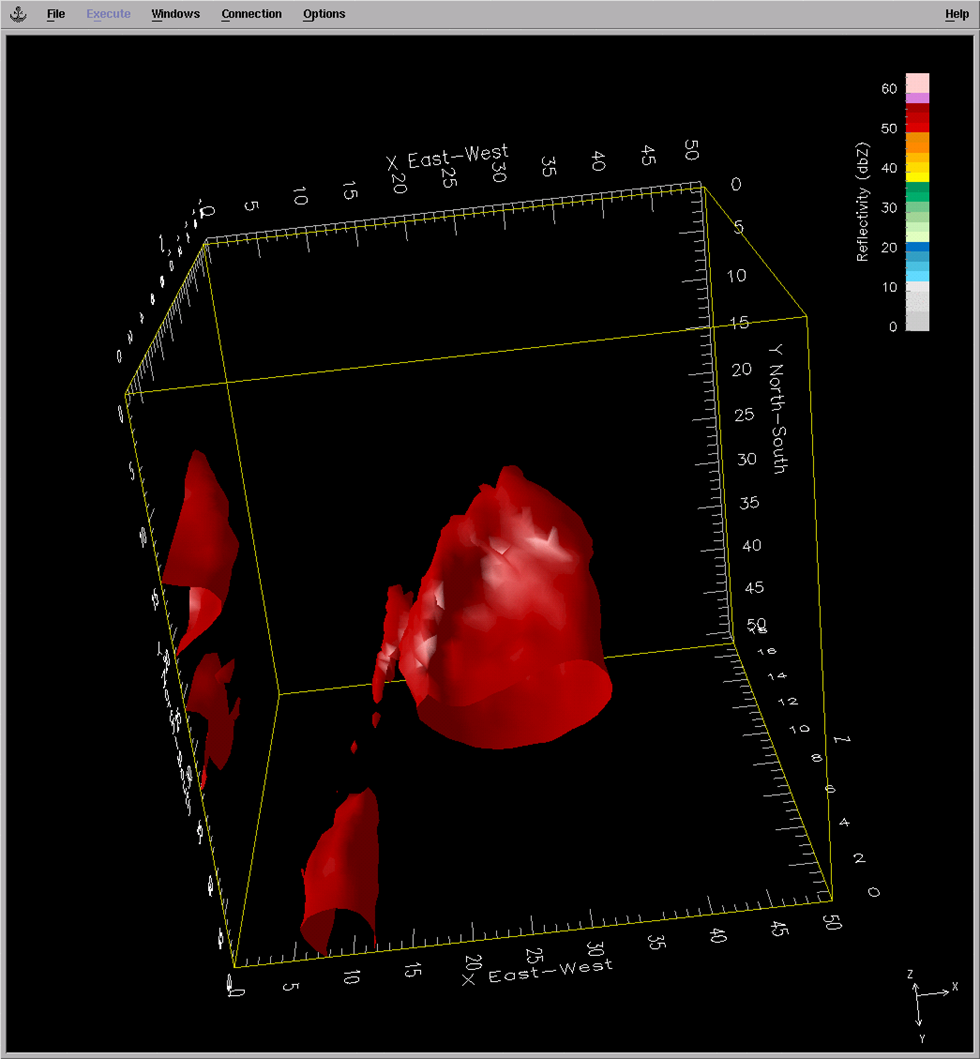
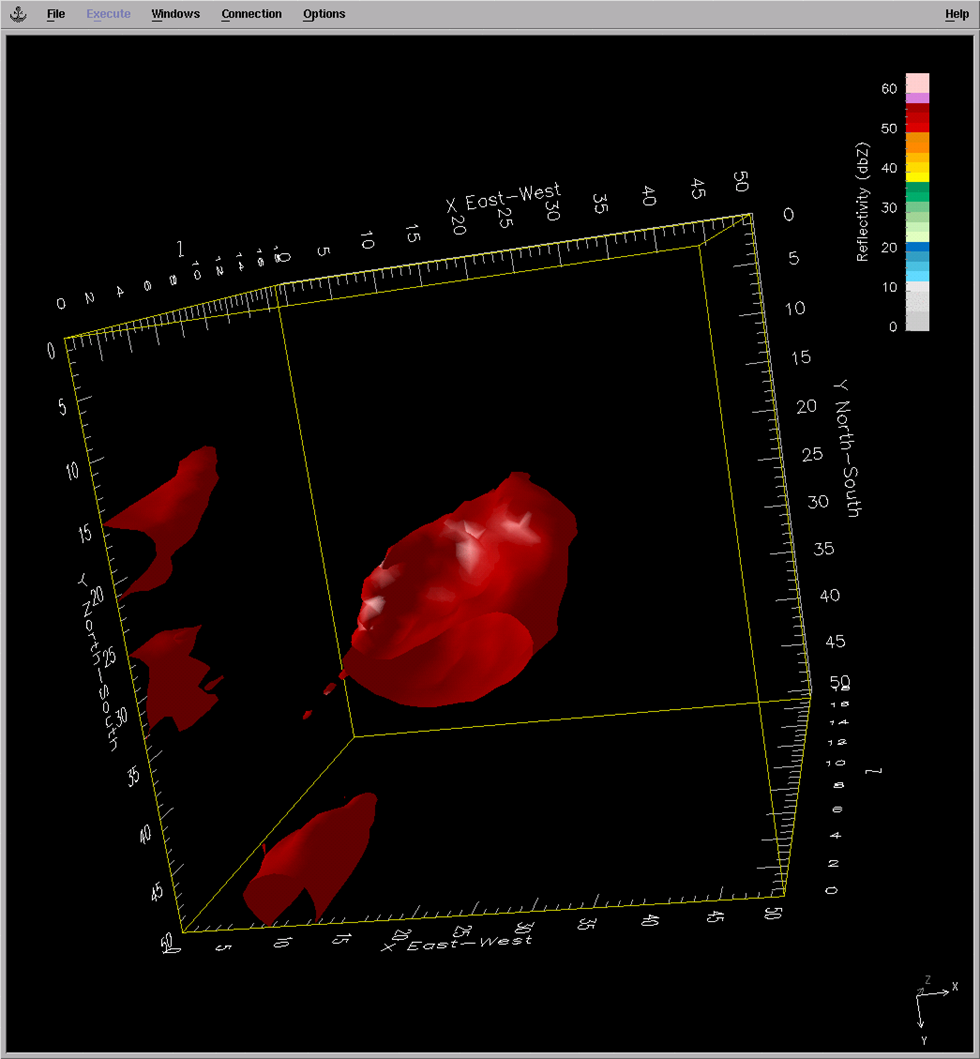
using an Open DX 3D viewer to examine the radar data. The following 3 images come from 3D rendering of the 50 dBZ iso-surface from the volume scan data. This particular case is of an Alberta supercell, rotated to see the presence of the BWER.
- plots of radar bin data sweep by sweep, as in the example below

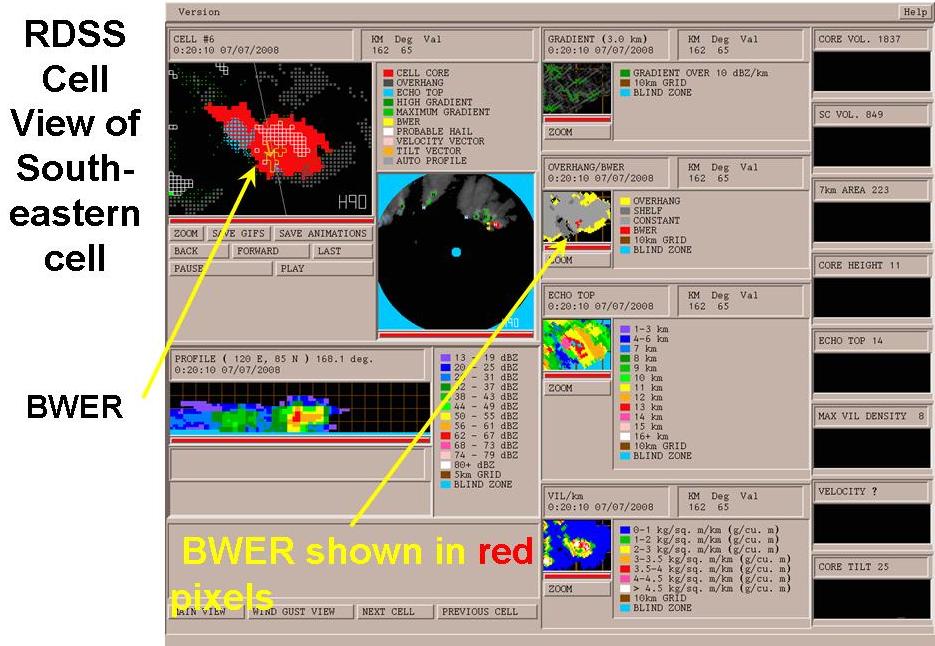
- Radar Decision Support System (RDSS) output as in the image below

39 severe weather cases from the summer of 2008 over the Canadian Prairies were identified with discrepancies between the new and old URP BWER algorithms. The new BWER algorithm was run a number of times using different configuration thresholds:
- Minimum BWER wall dBZ value varied from 36.5 to 38 dBZ
- –Vertical dBZ gradient varied from 4.5 to 5.0 dBZ per bin
- –Count threshold varied from 17 to 21
- Minimum BWER wall value of 38 dBZ
- 5 dBZ/bin vertical gradient
- 18 BWER count threshold
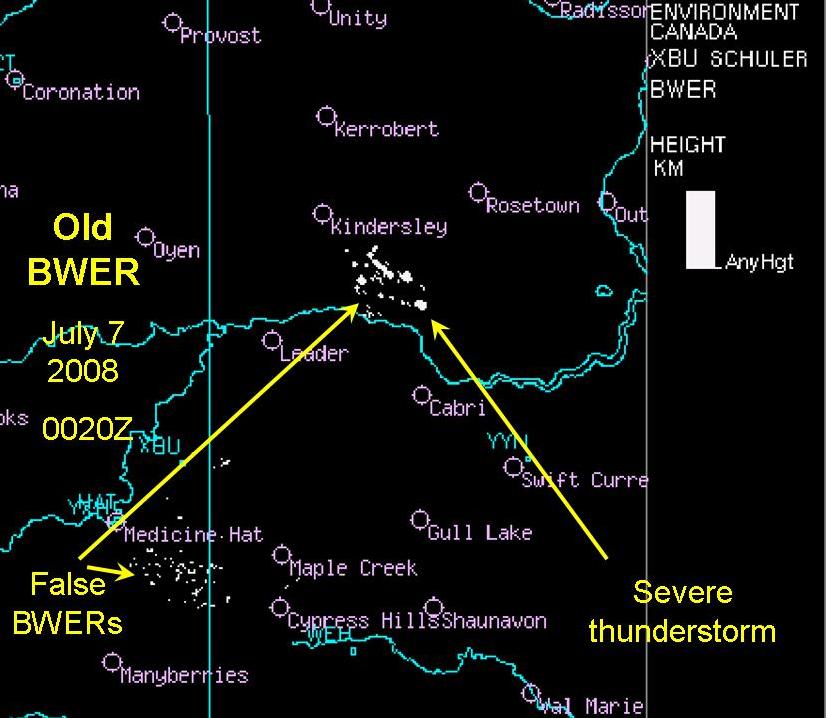
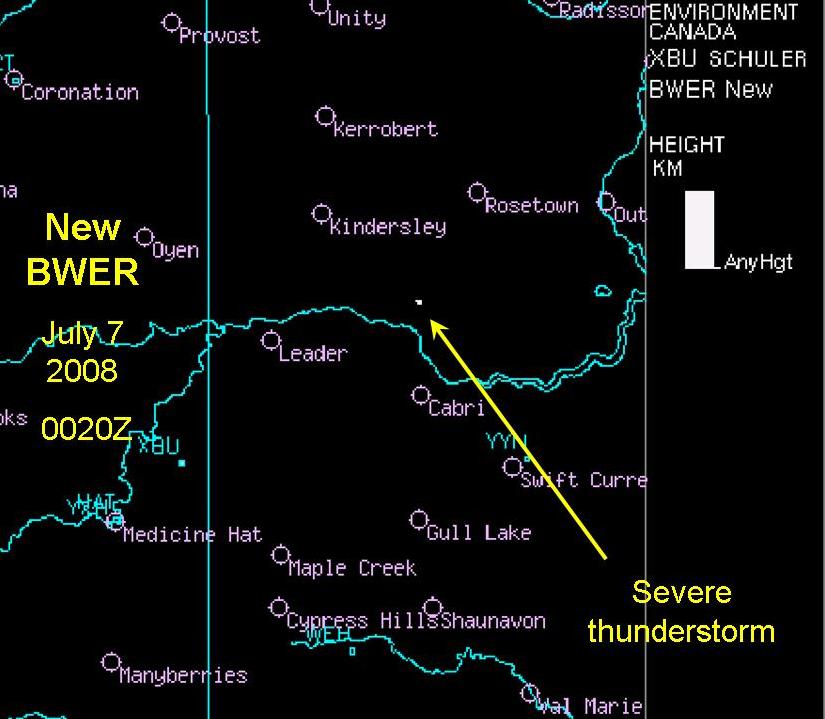
Of the 39 cases, 30 were handled better by the new BWER algorithm, 2 by the old algorithm, and in last 7 cases the two algorithms were equal.
The biggest difference was in the reduction of false alarms from the old BWER to the new BWER. Decreasing the BWER count threshold below 18 will increase the detection of Weak Echo Regions (WER), which still might be significant for severe weather, but it also increases the possibility of detecting a false WER which doesn't appear to be a location for a strong updraft and severe weather.
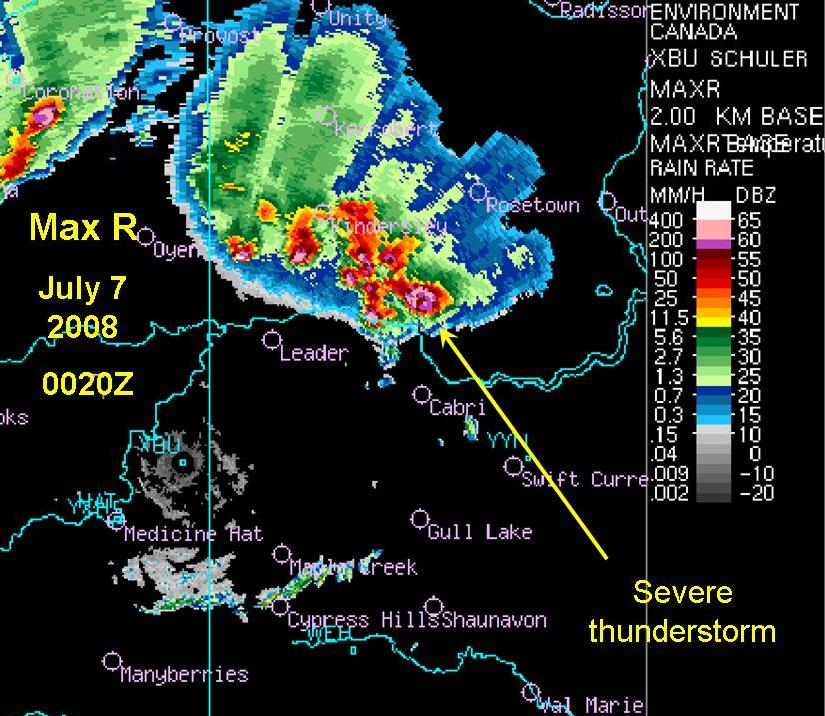
Case study