Mesoscale Flows
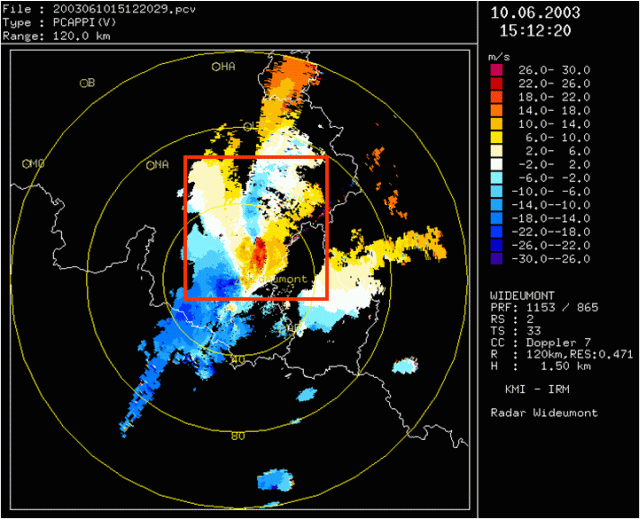
Example: Tornadic storm on 10 June 2003 in Belgium
 ]
]
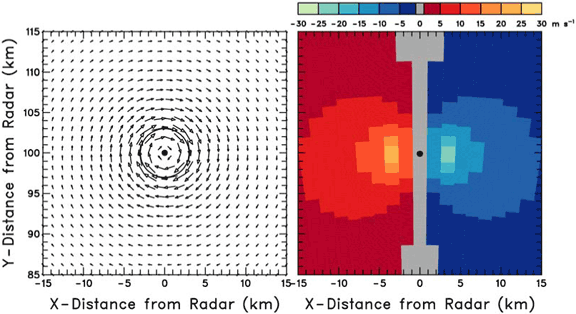
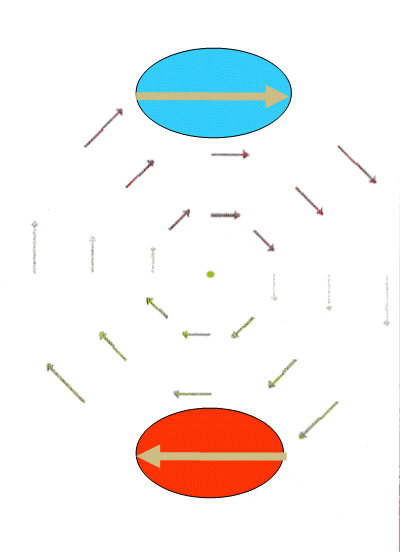
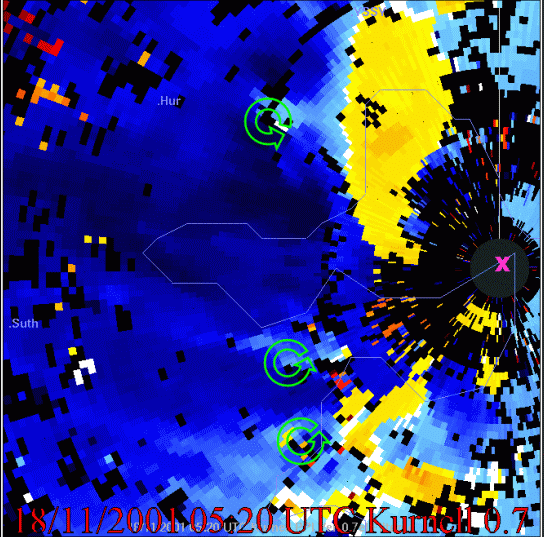

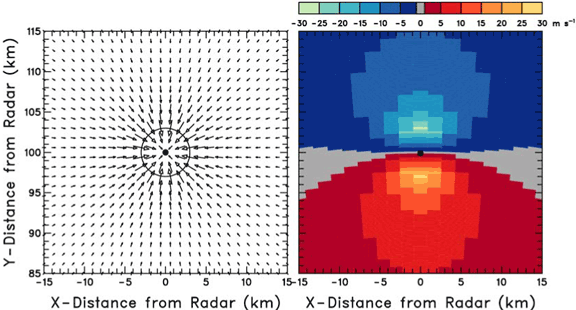


Figure 21. Note the region within the red square. We will take a closer look at the region in the following images
]
Figure 22. We can clearly see the cyclonic rotation in the region
within the square box in the left from the reflectivity image. The
corresponding single Doppler velocity is shown on the right. Doppler radar is valuable for analysing small scale wind flows
(especially in and around thunderstorms). Such flows are ideally viewed in a
storm-relative reference frame. Ground-relative winds contain a component due to motion of storm. Pattern may be less symmetric than in idealized examples that follow.
Anti-cyclonic Rotation
Figure 23. Orientation of the inbound/outbound maxima for pure anticyclonic rotation.
Figure 24. Ground-relative wind for storm moving slowly east
 |
 |
| Ground-relative wind for storm moving quickly east |
Ground-relative wind for storm moving very quickly east |
Figure 25. Ground-relative winds
Figure 26. This is a southern hemisphere case so you have to orient yourself differently. This is actually a case of anti-cyclonic rotation.
Pure Cyclonic Rotation (northern hemisphere)
Figure 27. Orientation of the inbound/outbound maxima for pure cyclonic rotation.
Convergence
Figure 28. Doppler velocity pattern
(right) corresponding to axisymmetric convergent flow (left). The maximum
radial velocity of 25 m s-1 (49 kt) is at a core radius of 3
km (1.6 n mi); the radius of maximum winds is indicated by the circle.
Black dot represents the center of the flow. Arrow length is proportional
to wind speed. Negative (positive) Doppler velocities represent flow toward
(away from) the radar.
Figure 29. A convergence line is highlighted with arrows.
Divergence

Figure 30. Orientation of the inbound/outbound maxima for pure divergence.
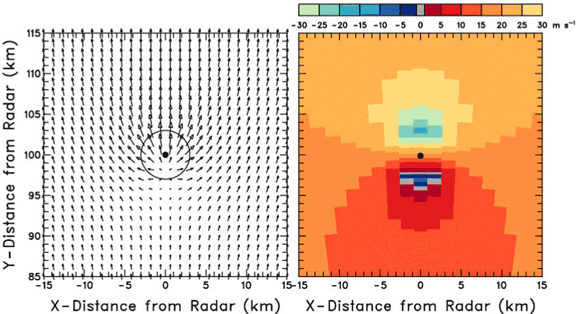
Figure 31. Same as Fig. above, except that the divergence feature is moving to the north at 18 m s-1 (35 kt) or a uniform flow field of 18 m s-1 from the south is superimposed on it. Note that Doppler velocity values exceeding 30 m s-1 on the far side of the divergence center are aliased.
Cyclonic Convergence
Figure 31. Doppler velocity pattern
(right) corresponding to combination of convergence and cyclonic rotation
fields (left) having the same core radius (3 km or 1.6 n mi); maximum inflow
velocity and maximum rotational velocity are the same with maximum resultant
velocity being 25 m s-1 (49 kt). Black dot represents the feature
center and the circle indicates radius of maximum winds. Arrow length is
proportional to wind speed. The feature center is 10 km (5 n mi) due north
of the radar. Negative (positive) Doppler velocities represent flow toward
(away from) the radar.