PPI Displays of Raw Doppler Data of Radial Wind
Operational measurement of Doppler weather radars consists of several
PPI measurements (measurements with constant elevation angle and
varying azimuth) at different elevation angles. The most simple
visualization of these "volume" data is the projection of single PPI
into the horizontal plane. The value in each pixel is then expressed by
certain colour from a colour or gray scale. The distance from radar r
and elevation angle of the corresponding PPI level a give the altitude of displayed target z = r sin(a).
Such visualization of a scalar field (as radar reflectivity or rain
rate) is clear and intuitive. The same is not true for a vector field
such as velocity and, thus, during PPI interpretation, we have to
remember that Doppler radar does not measure velocity vector but only
magnitude of its radial component.
 |
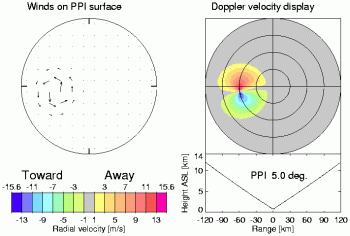 |
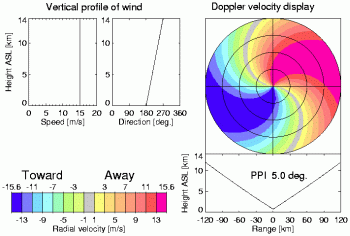
Figure 11. Doppler velocity fields simulation
Simulations of PPI visualization of Doppler velocities for
different observed wind fields were created to provide help with
operational interpretation of Doppler data in the future.
Simulations were done not only for horizontally uniform wind field but
also for more complex fields, e.g. divergence, convergence or cyclonic
and anticyclonic rotation. Simulation of aliased velocity and frontal
discontinuity wind field were also created.
Determining a broad scale wind profile
Some principles for “smooth” flows:
- Colour coding indicates whether radial velocities are inbound or outbound
- The
“zero isodop” (ZI) separates regions of inbound and outbound radial
velocities. Along the ZI the total wind is either tangential or zero
- With increasing range radar samples flow at higher and higher altitudes.
The zero isodop is a line connecting points of zero radial velocity
and is a key feature visible on most Doppler velocity images. It
separates a region of inbound velocity from a region of outbound
velocity and passes through the origin (the radar).
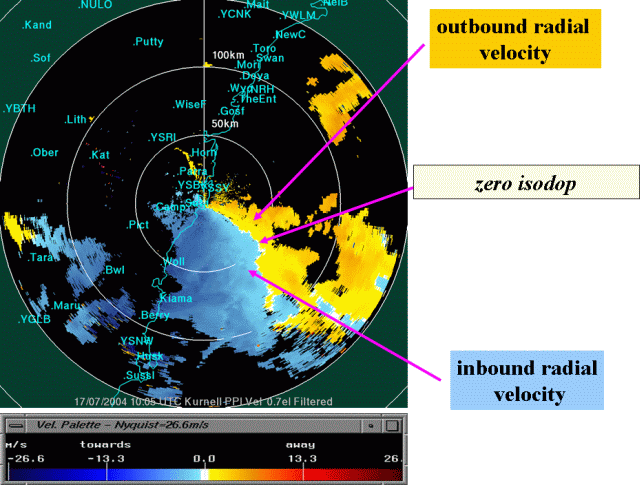
Figure 12. Identifying the outbound and inbound velocities from the radar display
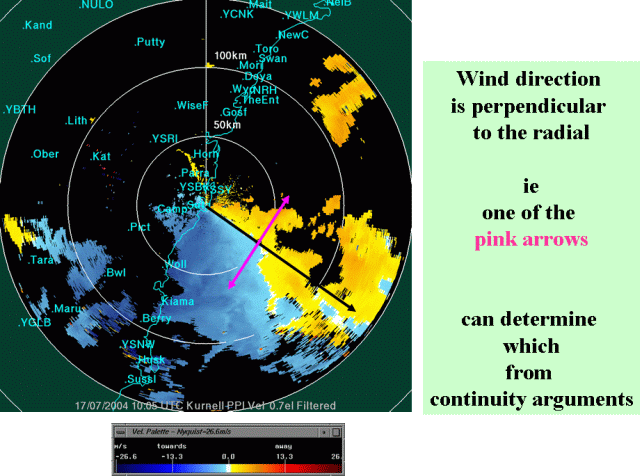
Figure 13. Using the ZI to determine wind direction
On the zero isodop the radial velocity is zero
so, either wind is calm
OR wind direction is perpendicular to radial.

Figure 14. Radial velocity on the radar display
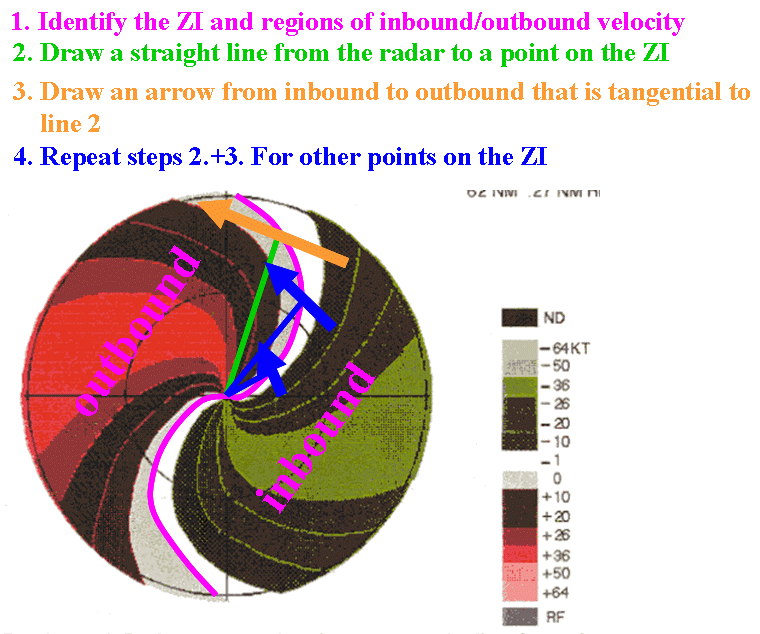
Figure 15. Determination of wind direction.