Velocity Azimuth Display
We can use a Doppler radar as a wind profiler if scatterers are present and horizontal wind shear is low (~uniform flow).
Figure 18. Uniform flow of 10 m/s from 360° as a representation of the phase shift in the horizontal plane and as a function of the phase
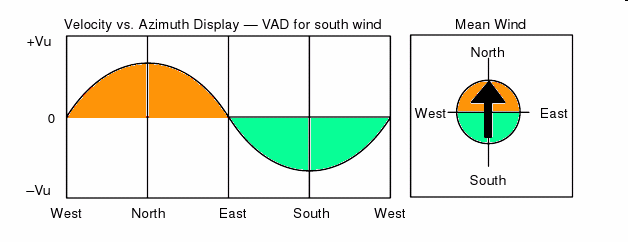
Although a Doppler radar only measures the radial component of target velocity, techniques have been developed in order to determine true wind speed and direction. Lhermitte and Atlas (1961) proposed a technique which is very useful when a Doppler radar is surrounded by scatterers having uniform motion. This is the Velocity-Azimuth display (VAD) which utilizes an azimuthally scanning beam at one or more elevation angles.
For a fixed elevation angle and range, corresponding to a fixed height, the radial velocity will vary sinusoidally as the antenna scans through a full 360 degrees. Since the radial outflow is positive and radial inflow is negative it is evident the wind direction can be obtained directly from such a display.
 By scanning at a number of elevation angles and ranges, vertical wind
profiles can be derived. These will be volume averages where the range
and elevation chosen will determine the size of the volume. Typically,
the first few km near the radar are not used.
By scanning at a number of elevation angles and ranges, vertical wind
profiles can be derived. These will be volume averages where the range
and elevation chosen will determine the size of the volume. Typically,
the first few km near the radar are not used.
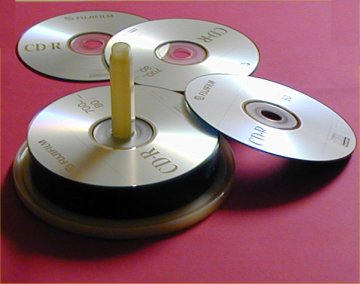
Consider a stack of CDs, each CD having a radius of 20-50 km, a thickness of between 100-500 m and an inner gap between 1-5 km; these would be very large CDs.
If these were stacked up, like the image to the right, one could envision them to be radar centered slices piled on each other. For each CD, one could compute a wind speed and direction that could be visualized in a number of ways (see the figure below)
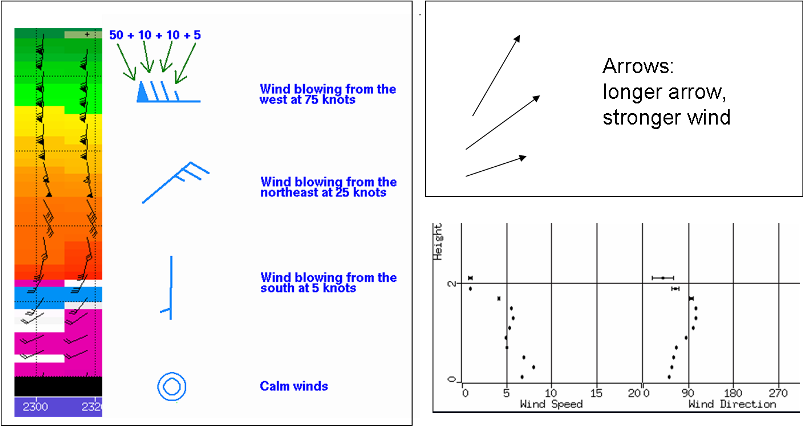
Visualizations of VAD winds. In Canada, it is traditional for the VAD winds to be visualized as in the bottom right but that needn't be the case.
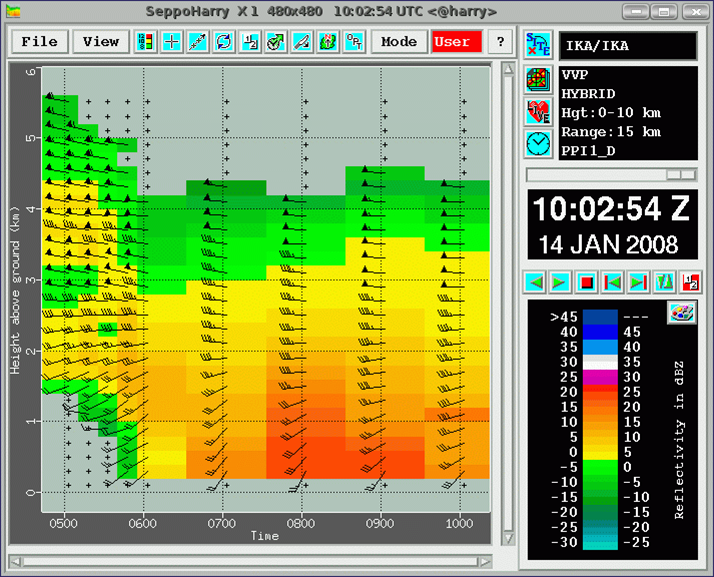
Winds turning clockwise and growing with height are an indication of warm advection. Reflectivity growing; warmer air and larger flakes.
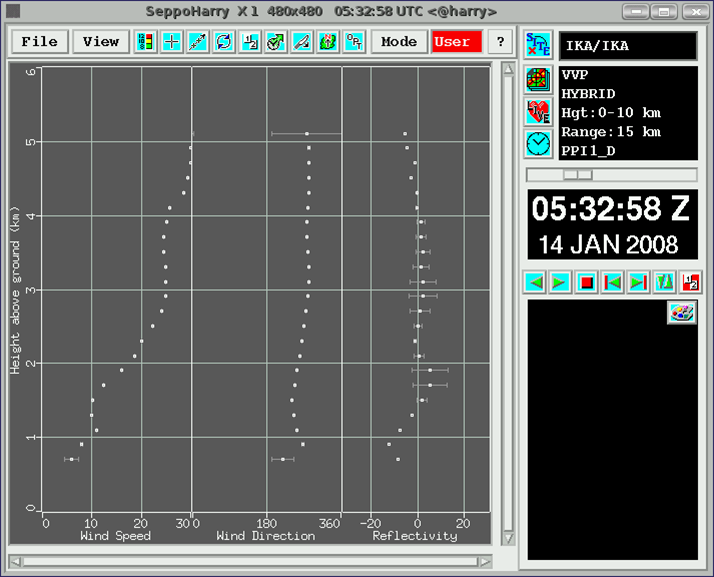
Single wind profile: speed, direction, and reflectivity as averages in a 15 km cylinder.
Yet another way of visualizing the VAD winds.
Experimental Hodograph VAD
The following changes to the VAD display are proposed:
- Add hodograph display and wind barb vs. height display for the 0.5, 1.5, 3.5 elevation angles
- If data are available to sufficient depth, calculate 0-1 km and 0-3 km storm-relative helicity from GRIB-derived Bunkers storm velocity and from mean observed storm velocity of radar's cells
- 0-6 km Bulk Shear
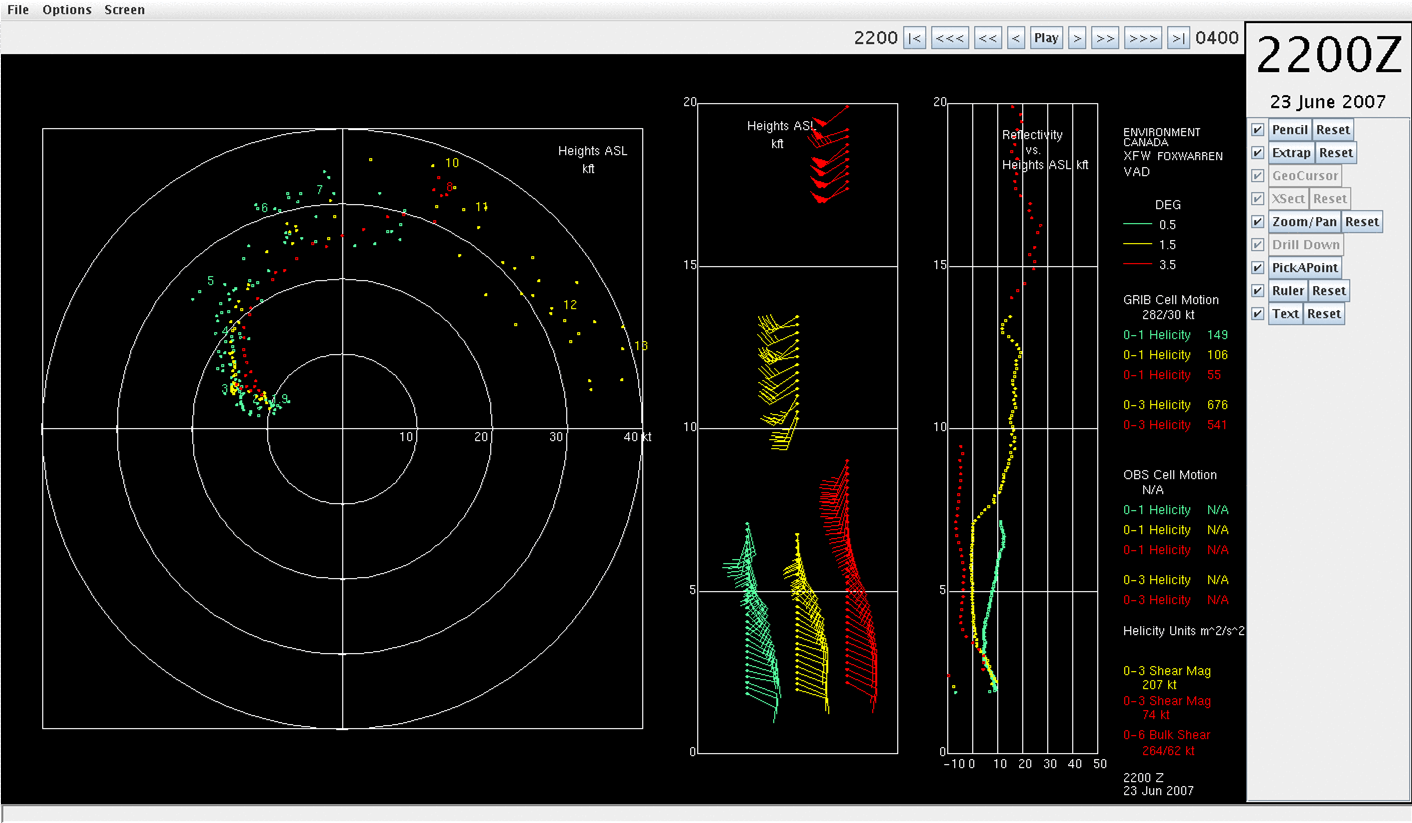
Pipestone pre-storm environment at 22Z June 23, 2007
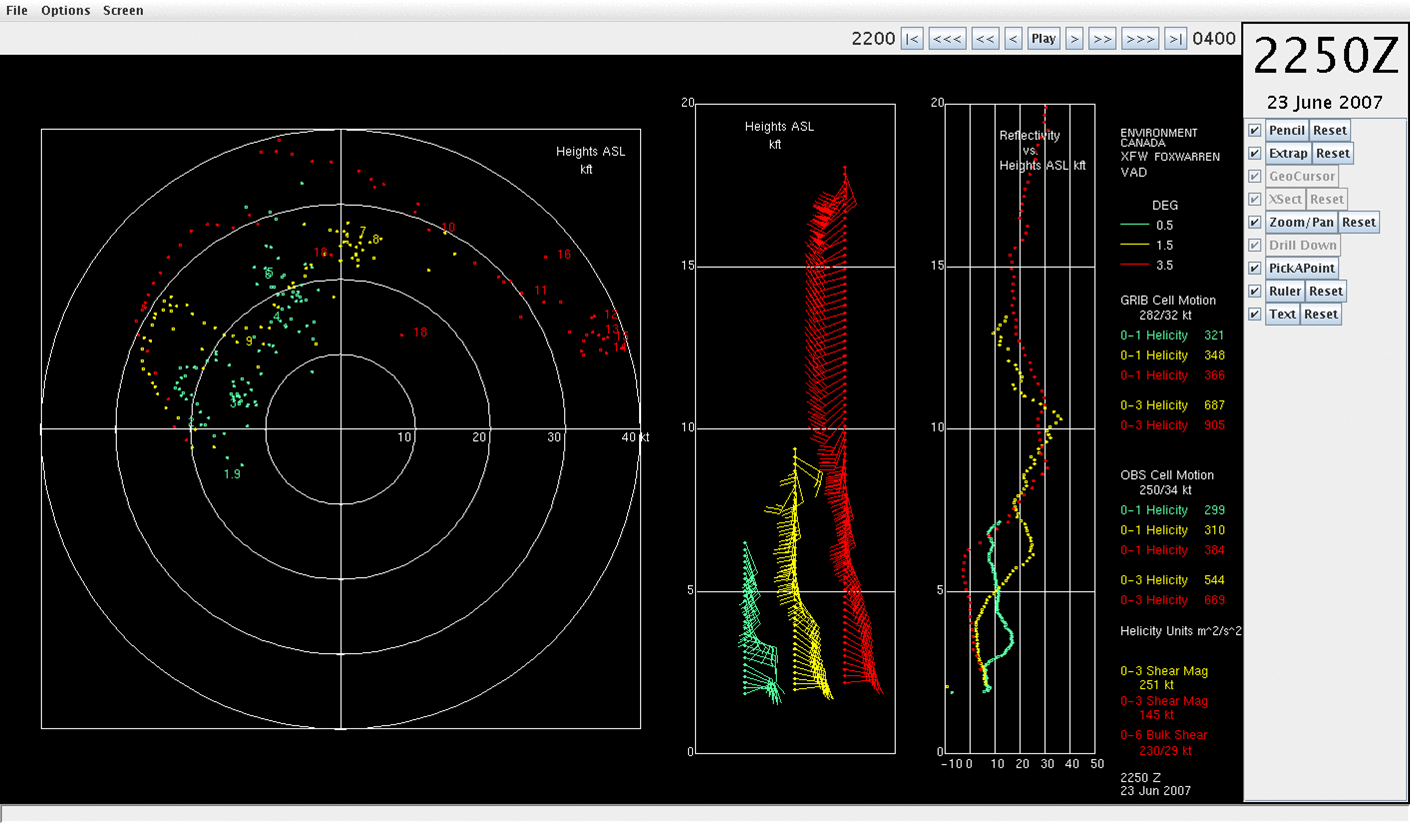
Pipestone storms approaching at 2250Z
Estimate the wind velocity from the table below. For
each height, measure variation of radial velocity with azimuth. (At
each height can get data from a number of elevation angles)