Statistics Lab Forum

Section 4: (Optional) What can be known from histograms?

Section 4: (Optional) What can be known from histograms?

par Marina Timofeyeva,
Nombre de réponses : 6

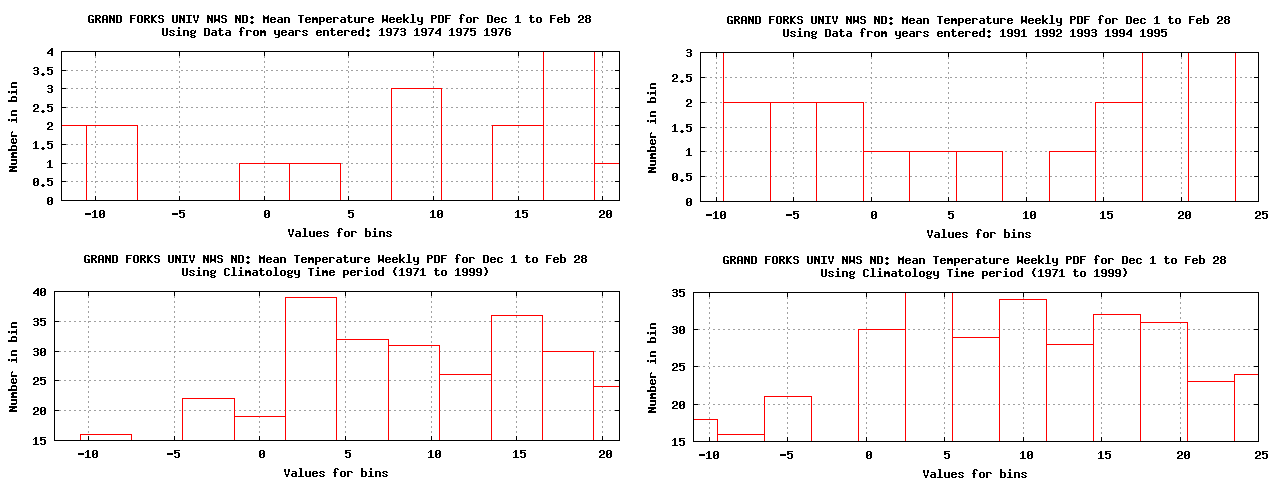
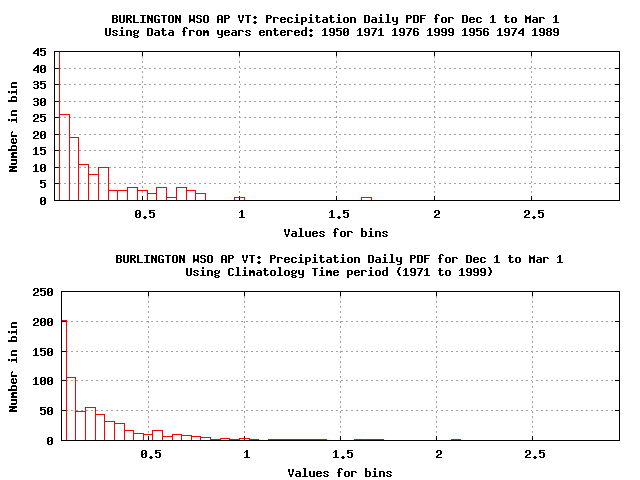
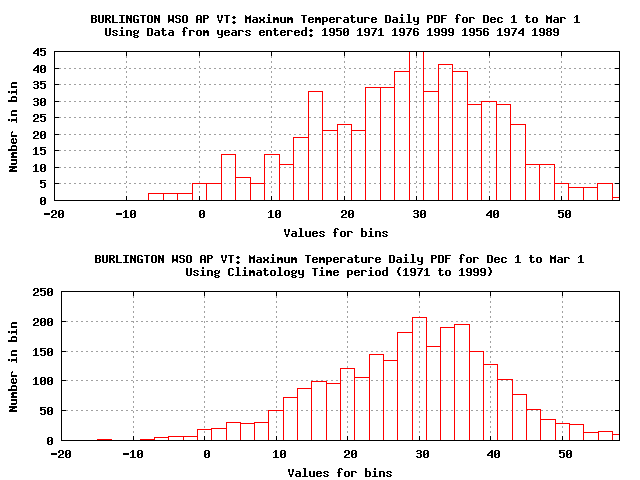
Histograms and distribution statistics describe a climate variable character. Each story is unique and informative for understanding local climate and communicating this to the NWS users. Here is one example...

The NOAA tool we can apply for such exercise is located at http://www.cdc.noaa.gov/data/usstations/

1. Select a state of your WFO location,

2. Select option for Data Distribution Plots and hit Submit button

3. Specify a site of your interest, Climate Variable, Time range, and hit Submit button. Hint: you may choose to examine composite histograms and statistics for selected period of observations. Use years for El NIno / La Nina, provided at http://www.cpc.ncep.noaa.gov/products/analysis_monitoring/ensostuff/ensoyears.shtml

4. Save your plot and use reply to this message to share your story with the group.

5. Be prepared to discuss


En réponse à Marina Timofeyeva

Re: Section 4: (Optional) What can be known from histograms?

par Rick Fritsch,

We wanted to do this one since it was at the bottom of the list and no one had replied yet. BUT - Alaska was not an option in the CDC website referenced - AGAIN. Do you know how often this happens to us up here when trying to use some of the really cool and way-sophisticated tools you all have down there? Maybe Environment Canada will take us in under their program. (Smiles)

En réponse à Marina Timofeyeva

Re: Section 4: (Optional) What can be known from histograms?

par Mark Ewens,
Histograms are a great tool to quickly visualize the distribution of a dataset. In the example given for the eastern ND DJF temperatures, the positive shift in the warm ENSO was very apparent. Histograms can be used as a "proxy" for estimating the PDF, and visually give clues to the skewness of the dataset. I chose to plot the Grand Forks NWS DJF temperature during two differing ENSO periods - 1971 to 1976 (dominant cool phase) and 1991 to 1995 (dominant warm phase). It's all I could think of at this hour :)
Annexe NWS_FGF_TempHistogram_1973_1976Comp_1991_1995.png
En réponse à Marina Timofeyeva

Re: Section 4: (Optional) What can be known from histograms?

par Paul Sisson,
Used LaNina years -1.0 or less to plot precip/MaxTemp daily distributions for Burlington VT. Only 7 years used.
It appears that most precip events are less than 1” in the LaNina years, and only two events an inch or greater. For temperatures, the stats are similar but the mode is 31 for LaNina vs 37 for Climo.
Annexe plotindexc.198.206.38.124.297.8.38.0.png
En réponse à Marina Timofeyeva

Re: Section 4: (Optional) What can be known from histograms?

par Kerry Jones,
This histogram is for the Albuquerque Int'l Airport (elev 5300). Selected daily temperature for Jan 1 to Dec 31, 1971-2011.plotindexc.216.38.80.221.297.8.53.31.png