Statistics Lab Forum

Section 3: How are the statistics applied?

Section 3: How are the statistics applied?

by Marina Timofeyeva -
Number of replies: 15

Examine different CPC websites and explain how statistics are used and what they mean in the specific content of CPC discussions, products and statements.

Use reply to answer the following questions:
1.
Describe the anomaly used in CPC ENSO Alert System http://www.cpc.noaa.gov/products/analysis_monitoring/enso_advisory/enso-alert-readme.shtml

2. In reference to trends at CPC seasonal outlook discussion, (http://www.cpc.noaa.gov/products/predictions/90day/fxus05.html) what statistical method did CPC use in their computations of the trend?

3. CPC produces climate forecasts (http://www.cpc.noaa.gov/products/forecasts/) for 3 categories Below-, Near- and Above- Normal. What statistics are used in the definition of these categories?
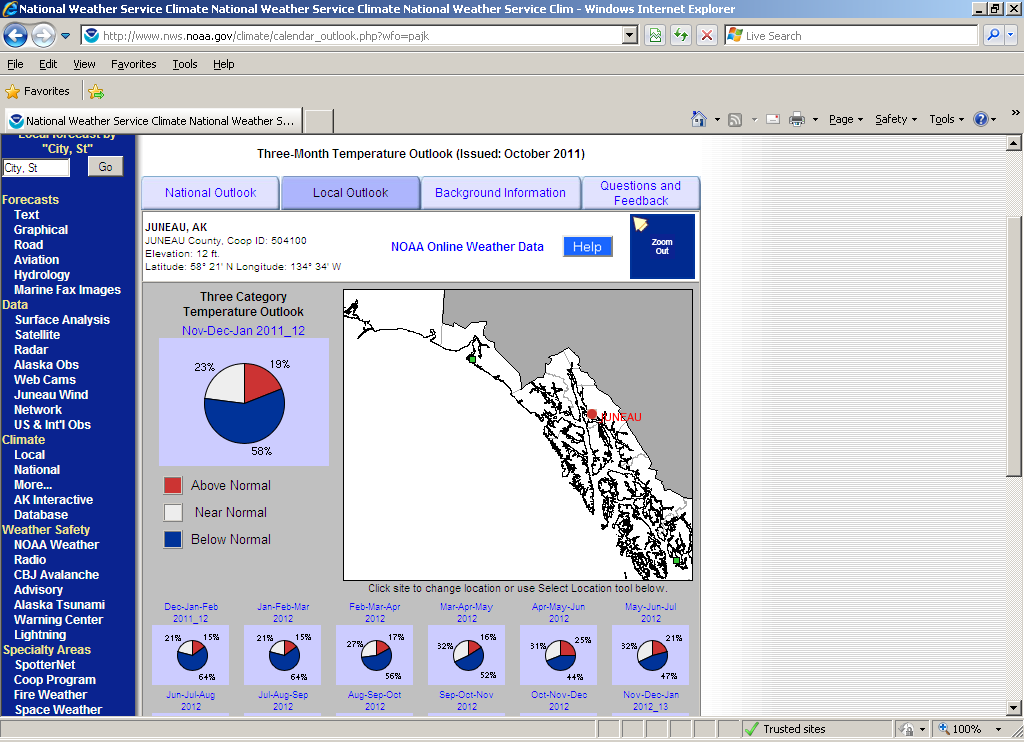

In reply to Marina Timofeyeva

Re: Section 3: How are the statistics applied?

by Mark Ewens -

The 3 month 0.5C threshold value used in the ENSO advisory system provides a significant headsup for the informed user. Understanding the system will statistically either be warm, cool or ENSO neutral at any given time for a season allows the ONI to capture the meaningful trends in the SSTA. Due to the relatively long period the ENSO responds in, that threshold is [likely statistically] significant enough to reduce the FAR and provide as accurate a prediction as possible. To quote the CPC itself Trends are..." APPROXIMATED BY THE OCN TOOL AS THE DIFFERENCE BETWEEN THE MOST RECENT 10-YEAR MEAN OF TEMPERATURE OR 15-YEAR MEAN OF PRECIPITATION FOR A GIVEN LOCATION AND TIME OF YEAR AND THE 30-YEAR CLIMATOLOGY PERIOD (CURRENTLY 1981-2010). " unquote. As far as the third question, what statistics are used, I presume you speak of the range and the first sigma variance from median. In this way, above or below are [statistically] significantly greater or less [respectively] than the median range.

In reply to Marina Timofeyeva

Re: Section 3: How are the statistics applied?

by Kristopher White -

1. The ONI index of 3-month running mean in the Nino 3.4 region is used to determine SST anomaly. The climatological base period is 1971-2000. SST anomalies in this region greater than 0.5C represent El Nino conditions, while values less than -0.5C represent La Nina conditions.

All I had time for. =)

In reply to Marina Timofeyeva

Re: Section 3: How are the statistics applied?

by Adam Baker -

1. In the ENSO Alert System, +/- 0.5 deg C thresholds are used from the Nino 3.4 dataset of SSTs across a three month period.

2. The trends in the seasonal outlook discussion use approximations by the Optimal Climate Normals (OCN) tool as difference b/t most recent 10-yr temp mean or 15-yr precip mean for a particular location and time of year and the 30-yr climatology period.

3. The long-term climate forecasts are generated after using the following tools: CFS (ensemble mean fcst), CCA (canonical correlation analysis) & ECCA, ENSO composites, OCN, CAS (contructed analog on soil moisture), and SMLR (screening multiple regression).

In reply to Marina Timofeyeva

Re: Section 3: How are the statistics applied?

by Tina Stall -

1. The anomaly used in this alert system is the sea surface temperature amount above or below the current set of climate normals. The value of the anomaly would be the average amount over the period of a month that the temperature is above or below the climate normal. +0.5 degrees or greater would be El Nino and -0.5 degrees or lower would be La Nina.

2. The method CPC uses would be a correlation between the most recent 10-year mean of temperature or 15-year mean of precipitation for a given location and time of year; and the 30-year climatology (currently 1981-2010. A high correlation with climatology would lean toward a persistence forecast for that time period and location.

3.  To define the Below, Near and Above normal categories, each category begins at equal chances of occurrence (33.33%). If the forecaster believed that one of teh categories is more likely, they will assign a higher percentage to that category. Because all 3 categories add up to 100% at all times and the Near Normal category usually remains at 33.33%, the other category is obtained by adding 33.33% to the dominant category and subtracting that total from 100%. With a higher than 33.33% for near normal, the other two categories will decrease by equal amounts to maintain the 100% total. The general method seems to be a probablility of exceedance of normal.

In reply to Marina Timofeyeva

Re: Section 3: How are the statistics applied?

by Jeremy Wolf -

CPC defines an El Nino as

"A one-month positive sea surface temperature anomaly of 0.5C or greater is observed in the Niño-3.4 region of the equatorial Pacific Ocean (5ºN-5ºS, 120ºW-170ºW) and an expectation that the 3-month Oceanic Niño Index (ONI) threshold will be met AND an atmospheric response typically associated with El Niño is observed over the equatorial Pacific Ocean.

For the trends, CPC used the difference between the observed temperatures over the past 10-15 years and what the 30 year climatology number is.  I'm not sure if this answers the precise stastical method or not as I didn't see that mentioned.

The statistics used for the seasonal outlooks are the latest climatological tercile categories (upper, middle, lower).  So if using the upper tercile, the probability of above normal temperatures from the CPC forecast would mean that chance of exceeding the lowest reading in the upper tercile category.

In reply to Marina Timofeyeva

Re: Section 3: How are the statistics applied?

by Matthew Kidwell -
1. The anomaly used is the difference difference from the 30 year normal with seasonal variability removed from it.

2. The trends used are the differences between the 30 year climate normals and the ten year temperature mean and 15 year precip mean.

3. These use the probability of exceedance statistics. The above normal category is the probability of exceeding normal.
In reply to Marina Timofeyeva

Re: Section 3: How are the statistics applied?

by Rick Fritsch -

1. The anomaly used is sea surface temperature departures from normal in the Nino 3.4 region of the equatorial Pacific Ocean (5ºN-5ºS, 120ºW-170ºW). When SST is 0.5 degrees below normal in this region, La Nina conditions are said to exist. If the 3.4 region remains below for 5 consecutive overlapping 3-month seasons.

2. The OCN (optimal Climate Normal) was used for forecasting trends. The OCN is a forecast based on persisting the average of the last 10 years for temperature and the last 15 years for precipitation.

3. The 3 climate categories are defined by dividing the 1981-2010 climatological distribution for temperature (but not precipitation) into thirds and issuing equal percentages (33.3% each to above, near, and below normal) for a forecast of "equal chances". This product is also known as the L3MTO. An increase in the probability of either above or below normal has the difference subtracted from the near normal and opposite extreme categories. Attached is a typical La Nina L3MTO forecast for Southeast Alaska.

In reply to Marina Timofeyeva

Re: Section 3: How are the statistics applied?

by Chuck McGill -
The main anomaly used is the one-month sea surface temperature anomaly, and if the anomaly is +/-0.5C or greater, then the 3-month Oceanic Nino Index is checked.
In reply to Marina Timofeyeva

Re: Section 3: How are the statistics applied?

by Edward Ray -

1. CPC issues an ENSO Watch, Advisory, and "final" Advisory product when certain thresholds are met for El Nino and La Nina condtions. For example El Nino: A one-month positive sea surface temperature anomaly of +0.5C or greater is observed in the Niño-3.4 region of the equatorial Pacific Ocean (5ºN-5ºS, 120ºW-170ºW) and an expectation that the 3-month Oceanic Niño Index (ONI) threshold will be met AND an atmospheric response typically associated with El Niño is observed over the equatorial Pacific Ocean. 

The same for La Nina except it's -0.5C.

Question: What  I find interesting is that there is an implication that El Nino or El Nina conditions can exist without observing a "typical" atmospheric response associated with a particular event. Is this because there is a lag in the "typical" atmospheric response, or are there examples when there was an ENSO event and the atmosphere did not respond as expected?

2. CPC used a difference between the most recent 10-year mean (15-year for percip) and the 30 year climatological norm (1981-2010).

3. CPC uses probabilities of exceedance (positive/negative) versus equal chances 50/50 chance of being above or below using a canonical correlation analysis. This is based on anomolies determined by the period of interest obtained by filtering out the 30 year climatological average.

In reply to Marina Timofeyeva

Re: Section 3: How are the statistics applied?

by Matthew Volkmer -

1. El Nino: A one-month positive sea surface temperature anomaly of 0.5C or greater is observed in the Niño-3.4 region of the equatorial Pacific Ocean (5ºN-5ºS, 120ºW-170ºW) and an expectation that the 3-month Oceanic Niño Index (ONI) threshold will be met. La Nina: A one-month negative sea surface temperature anomaly of -0.5C or less is observed in the Niño-3.4 region of the equatorial Pacific Ocean (5ºN-5ºS, 120ºW-170ºW) and an expectation that the 3-month Oceanic Niño Index (ONI) threshold will be met

2. STATISTICAL FORECAST TOOLS - CANONICAL CORRELATION ANALYSIS (CCA), SCREENING MULTIPLE LINEAR REGRESSION (SMLR), CONSTRUCTED ANALOGUE (CA) AND ENSEMBLE CCA (ECCA).

3. I did not find the statistical discription but found the attached histogram which shows the categories that are forecast generally for the Above, EC, and Below Normal Categories.


Attachment shortlegend.gif
In reply to Marina Timofeyeva

Re: Section 3: How are the statistics applied?

by Molly Woloszyn -
1. Sea surface temperature anomalies are used to define the presence of El Nino or La Nina conditions.

If a positive anomaly of 0.5C or greater is observed for one month in the Nino 3.4 region of the equatorial Pacific Ocean and similar conditions are expected to stay for 3 months (based on the ONI), El Nino conditions exist.

When the opposite occurs (negative anomaly of -0.5C or less for one month in Nino 3.4 and similar conditions are expected for 3 months), La Nina conditions exist.

2. Canonical Correlation Analysis (CCA), Screening Multiple Linear Regression (SMLR), Constructed Analogue (CA), and Ensemble (ECCA).

3.
3 categories: Below (B), normal (N), or above (A). For any calendar 7-day period, these categories can be defined by separating the 30 years of the climatology period, 1971-2000 (30 years), into the coldest 10 years, the middle 10 years, and the warmest 10 years. Because each of these categories occurs 1/3 of the time (10 times) during 1971-2000, for any particular calendar 7-day period, the probability of any category being selected at random from the 1971-2000 set of 30 observations is one in three (1/3), or 33.33%. This is also called the climatological probability. The sum of the climatological probabilities of the three categories is 100%.

In reply to Marina Timofeyeva

Re: Section 3: How are the statistics applied?

by David Sharp -

"Anomaly" - is the difference between the observed (forecast) value and the long-term normal value. For ENSO alerting, whenever the SST anomaly is appreciably above or below normal; values of +0.5 or greater (El Nino) and -0.5 or less (La Nina) are used across the 3.4 region.

"Trend" - is the difference between the average of the most recent 10 (15) years and the climo T(P) for a given time/place; use of correlations.

"Below, Near, and Above" - are terms used where the 30 year record is broken down into the coldest 33.3%, the warmest 33.3%, and the middle 33.3% temperature-wise. This is similarly done for precipitaton. So, equal chances represents a 33% chance that it could any of the three. Then, if confidence is sufficient as to assign any of the three categories to a region, then that percentage increases and the others proportionally decrease since the sum total must add to (near) 100%. Confidence for an assignment is derived from using exceedance probabilities with the threshold being that of normal.

In reply to Marina Timofeyeva

Re: Section 3: How are the statistics applied?

by Kerry Jones -
CPC utilizes a one-month positive (negative) sea surface temperature anomaly of 0.5C or greater (-0.5C or smaller) that is observed in the Niño-3.4 region of the equatorial Pacific Ocean (5ºN-5ºS, 120ºW-170ºW) and an expectation that the 3-month Oceanic Niño Index (ONI) threshold will be met for La Nina (-0.5C) or El Nino (+0.5).
In reply to Marina Timofeyeva

Re: Section 3: How are the statistics applied?

by Shawn Rossi -

1. Sea Surface Temps in Nino 3.4 region are +/- 0.5C. Length of time and atmospheric conditions will determine type of alert.

2. CCA - Canonical Correlation Analysis

3. Not sure.

In reply to Marina Timofeyeva

Re: Section 3: How are the statistics applied?

by Andrew Loconto -
1. CPC partly defines a specific ENSO phase based on a one-month, persistent SST anomaly of -0.5 degrees C (in the case of La Nina) or lower in the Nino-3.4 region, or a +0.5 degrees C (in the case of El Nino) or greater in the Nino-3.4 region.

2. CPC uses a tool called the Optimal Climate Normals (or OCN) to compute recent trends in temperature and precipitation. The OCN is based on a difference between recent temperature and precipitation and the currently valid 30-year climate normals (1981-2010). It's used to adjust the typical seasonal ENSO composite probabilities of temperature and precipitation for recent trends, like as shown in the bottom two graphs for each season here:

http://www.cpc.ncep.noaa.gov/products/precip/CWlink/ENSO/composites/

3. The three terciles in CPC's extended range forecasts are based on conditional probabilities for above, below and near normal (or median if dealing with precip.). While all three elements are equally weighted (33.3% for above, near, or below), in shaded areas on the forecast charts, the conditional probabilities are higher toward the color code (so red shading would have slightly higher conditional probabilities for above-normal temperatures, etc...).