Statistics Lab Forum

Section 1: How normal is the climate normal?

Section 1: How normal is the climate normal?

by Marina Timofeyeva -
Number of replies: 23

This is an interesting question to examine. There are several different meanings in using this statistical term.

Conversational Approach. Very often people refer to climate normal to assess the "usual or typical" climate state at an area or a location. "Usual" or "Typical" in the language of statistics means the most frequently occurring.

Technical Approach. To complicate the story, the term "normal" implies usage of a Normal distribution properties. In case of Climate Variable Normal, it means a Normal Distribution was fit to the climate data.

NWS Directive Approach. Use the NWS Directives 10-1004 on Climate Records http://www.weather.gov/directives/sym/pd01010004curr.pdf to get the definition.

Question for you to think about: How would you explain what the climate normal is to a curious and statistically-savvy customer at your local office?

Exercise for you to do:

1. Obtain your local office area climate normal using xmACIS, located at http://xmacis.nrcc.cornell.edu/*, using the drop down menus to select the Daily/Monthly Normals or Temperature/Precipitation Graphs.

*NOTE: To access this site you have to use your NOAA computer. If you are tele-working today use http://www.cdc.noaa.gov/data/usstations/

2. Share with the group what your climate normal is?

3. Be prepared to discuss your case.
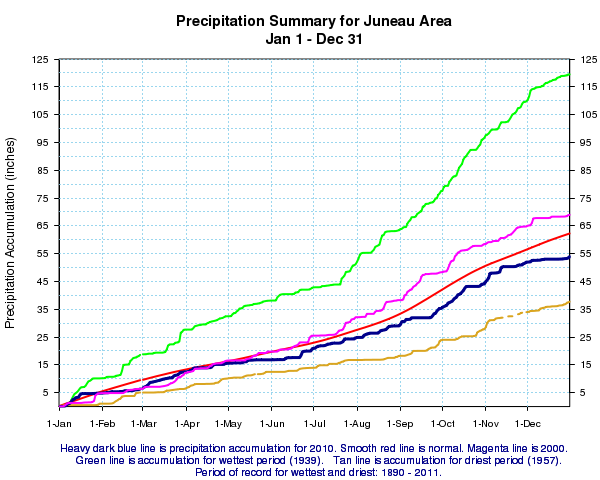
In reply to Marina Timofeyeva

Re: Section 1: How normal is the climate normal?

by Kristopher White -

This is my answer:

The daily maximum normal temperature for Huntsville, AL for Oct 24th is 72F.

The daily minimum normal temperature for Huntsville, AL for Oct 24th is 48F.

The mean daily normal temperature for Huntsville, AL for Oct 24th is 60F.

This is my favorite time of year!!

The mean monthly temperature for Huntsville, AL for October is 62.8F.

The mean monthly precipitation for Huntsville, AL for October is 3.59 inches.

In reply to Marina Timofeyeva

Re: Section 1: How normal is the climate normal?

by Adam Baker -
For the Indianapolis Area, the normal average temperature ranges from 28.1 deg F in January to 75.4 deg F in July.  The normal monthly precipitation ranges from 2.32" in Februrary to 5.05" in May.  These normals are from the 1981-2010 period.
In reply to Marina Timofeyeva

Re: Section 1: How normal is the climate normal?

by Mark Ewens -
As a mid latitude continental station, our normals vary from single digits above zero in the cold season, then rise nearly 60 egrees F in mid boreal summer. Based on some local stats analysis, normal daily variances (plus/minus 1 sigma) can be as large as 11 degrees on the unfiltered data, suggesting even 'normal' variances are pretty significant. Normal precipitation is around 20 inches but varies significantly from west to east across our CWA. Being in the northern plains, our 'weather'  is sensitive to the ENSO, which in part explains the tremendous variances normal to our climate.
In reply to Marina Timofeyeva

Re: Section 1: How normal is the climate normal?

by Tina Stall -

I would tell the person that the climate normal is a running 30-year mean, for a given variable like Temperature at a particular site. So every ten years, a mean is calculated for the previous 30 years of daily data. For the site to be eligible, it must have at least a 30-year period of record.

For the San Diego area (a threaded record going back to 1850), the normal rainfall for a calendar year is just under 10 inches at 9.77 inches - using the most recent climate normals for 1981-2010. The normal maximum temperature ranges from 65 degrees F in December and January to 77 degrees F in August/September. The values for minimum temperature are 48 and 67, respectively.

~Tina (SGX)

In reply to Tina Stall

Re: Section 1: How normal is the climate normal?

by Mike Buchanan -
The climate normal temperature for Corpus is 72.1 degrees. The precipitation climate normal for Corpus is 31.76 inches.

The method used for the calculation of the normal temp is the running mean of the monthly temps for the 30 year period from 1981 through 2010.\

Mike and John (CRP)
In reply to Marina Timofeyeva

Re: Section 1: How normal is the climate normal?

by Jeremy Wolf -
For Spokane, WA normals highs range from 32 degrees F on January 1st to 86 degrees on August 31st.  We have a much larger diurnal swing in temperatures normally during the summer compared to the winter.  For November and December Spokane averages more precipitation compared to any other months with 2.30" each month.  August is the driest month with 0.59". 
In reply to Marina Timofeyeva

Re: Section 1: How normal is the climate normal?

by Erik Heden -

From Erik and Mike in Binghamton.

The monthly climate normal snowfall for the month of October for Binghamton, NY" is 1.0" (1981-2010). However when looking at the data, we have only had 1.0" or more 8 times in 30 years. Less than 1 inch fell 22 times. The mode, or most frequently occurring total is actually 0.0 inches (or more likely, a trace). The median is also quite a bit lower than the mean.

The mean in this case is not a good representation of the snowfall that one might expect (an inch average each October in Binghamton). One year (1993) skewed the data with a value of 11.6". So, if one were to expect an inch of snow at BGM, based on the climate "normal", one would get less than expected most of the time.

The climate normal is the mean of values over a 30 year period. In the example above, the 30 values for October, are skewed by one outlier.
In reply to Marina Timofeyeva

Re: Section 1: How normal is the climate normal?

by Dean Hazen -
The NWS uses a 30 year period of record to determine normal or mean values expected. These normal or mean values are updated every 10 years to account for climatic changes. At Pocatello, the following ranges are reflected in the 1981 to 2011 normals:

Max T: 32.6F in January to 87.8 in July
Min T: 16.0F in January to 52.0 in July

Note the difference in the normal Max/Min T is 16.6F in January and 35.8F in July.

Precip: 0.61" in August to 1.46" in May with an annual total of around 12".

Note that the top 3 wettest months are May, March & December and the top 3 driest months are August, July and September.
In reply to Marina Timofeyeva

Re: Section 1: How normal is the climate normal?

by Jared Klein -
Climate normals are calculated on daily, monthly, seasonal and annual time scales. The monthly climate normals for max temps at Washington D.C. range from 43.4F in January to 88.4F in July. The monthly climate normals for min temperatures range from 28.6F in January to 71.1F in July.

The climate normals are based off of data (in this case temperatures) from the most recent three consecutive decades of 1981-2010.
In reply to Marina Timofeyeva

Re: Section 1: How normal is the climate normal?

by Rick Fritsch -

Juneau Alaska is warming; more so in the Winter than Summer. Our old January climate normal average January temperature (1971-2000) was 25.7F. Our new normal January average temperature is is 28.2F. We are seeing increases in the Summer temperatures as well, but not as much as in the Winter. We are also seeing  no change or even a slight cooling for both Spring and Autumn.

As predicted by the IPCC, in addition to rising temps, we are also seeing an increase in annual average precipitation. Interestingly, during the last year in the new climate normal period, we recorded less than what is now considered to be "normal" precipitation. Attached graphic plots precip for several years: wettest, driest, 2010, and 2000. The red line shows our new "normal" accumulated precip curve.

In reply to Marina Timofeyeva

Re: Section 1: How normal is the climate normal?

by Andrew Loconto -
I'd state to the person that the climate "normal" is a 30-year moving average of any climate variable (temperature, precipitation, etc...). Year-to-year variations are smoothed out. These 30-year "normals" are recalculated every 10 years to account for recent trends.

For Burlington VT, our normal max temperature for October 24th is 54 degrees and our normal min temperature for October 24th is 37 degrees. Our October monthly max and min temperatures are 57.2 degrees and 39.1 degrees.

Andrew Loconto
Meteorologist Intern
WFO Burlington, VT


In reply to Marina Timofeyeva

Re: Section 1: How normal is the climate normal?

by Matthew Kidwell -
The normal max temperature for Eureka on October 24th is 61 while the normal min 46 degrees. The normal precipitation for the month of October is 2.24 inches. The normals are a 30 year average of the data for this date. To get more technical: Climate normals are a normal distribution fit to the climate data.
In reply to Marina Timofeyeva

Re: Section 1: How normal is the climate normal?

by Edward Ray -

At Jackson, Ky (WFO JKL) our average temperature ranges from 34.9 in January to 75.4 in July. Average maximum temperature ranges from 84.6 in July to 43.1 in January. Our average minimum temperature ranges from 26.8 in January to 66.1 in July.

WFO JKL is on a ridge about 800 ft above the valley floor and is considered in our thermal belt. Our valley locations have quite a different climate, especially at night were typically we can see a 10 to 30 degree split between overnight lows on the ridges versus the valley areas. For West Liberty which is representative of our valleys, the average temperature ranges from 31.4 in January to 73.5 in July. Average maximum temperature ranges from 84.9 in July to 41.4 in January. Our average minimum temperature ranges from 21.3 in January to 62.1 in July.

Our average precipitation/snow (for JKL):

Jan    Feb   Mar  Apr   May   Jun   Jul    Aug   Sep   Oct   Nov   Dec

3.61  3.75  4.12  3.83  5.20  4.70  4.65  3.69  3.46  3.19  3.96  4.18
7.1     7.0    2.9   1.0   0.0    0.0    0.0    0.0   0.0    0.1   0.5    4.9


In reply to Marina Timofeyeva

Re: Section 1: How normal is the climate normal?

by Matthew Volkmer -

The Climate Normals for Melborne County Warning Area have been recently updated on our website and are available here.

http://www.srh.noaa.gov/mlb/?n=monthly_normals_new

The coolest month is January with an average high temperature of 68.7 degs and average low temperature of 47.3 degs at Daytona Beach.

The warmest months on average are July and August when average high temps range from 89.6 to 91.8 degs at our climate sites.

East Central Florida has two distinct wet and dry seasons. The wet season typically begins in late May and lasts until mid October. The typical dry seaon runs from mid October to mid to late May. More info:

http://www.srh.noaa.gov/mlb/?n=wetdry

Highest monthly rainfall amounts gererally occur in the summer months between June and September with daily sea breeze summer thunderstorms and occasional tropical activity that affects our area.

In reply to Marina Timofeyeva

Re: Section 1: How normal is the climate normal?

by Chuck McGill -
In reality, normals aren't what should be expected, as they are the "massaged" averages of the extremes. While they give an idea of whether you need a light jacket, heavy coat, or can wear shorts, they don't always indicate what the temperatures will be on any given day.

In Burlington, our warmest normal high temperature is 81 degrees, while our coldest normal low temperature is 10 degrees. However, our all-time record high is 101, and our all-time record low is -30. Our all-time coolest max temp in July was 56, while our all-time warmest min temp in January was 58.
In reply to Marina Timofeyeva

Re: Section 1: How normal is the climate normal?

by Vince Godon -
In Grand Forks, ND, we start the month of October with a ave high of 62. By the end of October, it drops to 45. The amount of sun really drops off through the month as well.
In reply to Marina Timofeyeva

Re: Section 1: How normal is the climate normal?

by Shawn Rossi -

The 1981-2010 Normals for the Grand Island, NE observation site on October 25 is:

High: 61 F

Low: 36 F

Precip: 0.05" (Normal Snowfall 0.1")

In the summer, the normal High peaks at 88 degrees in July and in winter, the normal High climbs to only 35 degrees in January. Normal low temperatures range from 14 degrees in January to 65 degrees in July. The normal annual liquid precipitation is around 26", and the normal snowfall is around 29".

In reply to Marina Timofeyeva

Re: Section 1: How normal is the climate normal?

by David Sharp -
Within our Forecast Area, I used Daytona Beach, FL. The average high temperature in January is 68.8 degrees with an average low temperature of 47.6 degrees. This is the coolest time of the year. The warmest time of the year is July/August with an average high temperature of 90.1 degrees and an average low temperature of 72.4. Daytona Beach is near the coast so is moderated by local sea breeze circulations. This location reaches a peak in average daily rainfall of 0.24 in August and a lull in April at 0.05 inches (before the onset of the wet season).
In reply to Marina Timofeyeva

Re: Section 1: How normal is the climate normal?

by Molly Woloszyn -
In Chicago, Illinois, the normal average daily temperatures range from 74oF in July to 23.8oF in January, giving Chicago an average annual range of 50.2oF.

Maximum temperatures generally range from a normal of 31oF in January to 84.1oF in July. The minimum temperature normal is lowest in January (16.5oF) and once again highest in July, when the normal minimum temperature is 63.9oF.

In Chicago, the most precipitation is generally expected in the summer, specifically August, when the normal monthly precipitation is 4.9". The lowest monthly precipitation is generally in January, when the normal precipitation for the month is 1.73".

Snowfall normally occurs in 7 months out of the year in Chicago, with the highest monthly snowfall totals occurring in December, January, and February.

Based on the 1981-2010 climate normals.


In reply to Marina Timofeyeva

Re: Section 1: How normal is the climate normal?

by Adrienne Leptich -

According to the temperature graph attached, the avg. min temp at Central Park, NY, ranges from 29 in Jan. and 69 at the end of July. The avg. max temp ranges from 39 in Jan. and 84 at the end of July. The graphs are more intuitive and provide more information than the tables. For example, four record highs were broken this year, but no record lows were reached. This information is not attainable from just the tables themselves.

In the precipitation graph, also attached, it can be inferred that we are on pace to break the all-time wettest year record. However, climatologically 18 inches of rain over the next 2 months is highly likely. Another thing to note is the fact that precipitation was slightly above normal through the first 7 1/2 months of the year. The region received copious amounts of rain in August and September causing a sharp rise in precip amounts.


In reply to Marina Timofeyeva

Re: Section 1: How normal is the climate normal?

by Lindsay Tardif-Huber -
Here is Bismarck, ND the normal maximum temperature for October 24th is 53.3 degrees Fahrenheit with the minimum is 29.1 degrees Fahrenheit. Our daily maximum temperature normals ranged from 65 on the 1st to 49 on the 31, with the minimum temperature normals ranging from 38 on the 1st to 26 on the 31st. Monthly normal precip is 1.25" with a daily normals ranging from 0.05" at the beginning of the month to 0.03" at the end of the month. Normal snowfall for October is 2.2.
In reply to Marina Timofeyeva

Re: Section 1: How normal is the climate normal?

by Kerry Jones -

Not surprisingly, we have a lot of extremes here in the Southwest CONUS, particularly when it comes to precipitation. So, for example, average daily precipitation does not mean too much to the general public since average annual precipitation in a high desert environment is a collection of extreme events. I prefer to use the term "average" vs. normal, since it conveys the notion that is used by the NWS that "normal is a period mean computed by NCDC for an NWS observing station from a period comprising three consecutive 10-year decadal periods (for example, 1971-2000).

Here at Albuquerque during the month of October...

average monthly maximum temperature is 70.9F.

average monthly minimum temperature is 43.2F.

The average monthly temperature is 57.0F.

The average monthly precipitation is 0.69 inches. However, within the past several years, ABQ has received as much as 2.88 inches in October 2004, and as little as 0.08 inches in October 2008.

In reply to Marina Timofeyeva

Re: Section 1: How normal is the climate normal?

by Paul Sisson -
BTV Climate is temperate with normal daily maximum temperatures ranging from 81 in mid summer to 27 in mid winter. Normal daily minimum temperatures range from 10 in mid winter to 61 in mid summer. We average around 37” of rainfall a year. The wettest month is July with around 4 inches and the driest with less than 2” in February. We average 81” of snowfall per year and the record is 145.4”.

Statistically, the normal is derived by interpolating from the respective monthly normals using a cubic spline function. A normal is a period mean computed for a 30 year period comprising three consecutive 10-year decadal periods (for example, 1981-2010).