Radar Meteorology Glossary
Special | A | B | C | D | E | F | G | H | I | J | K | L | M | N | O | P | Q | R | S | T | U | V | W | X | Y | Z | ALL
A |
|---|
A ScopeA cathode ray tube that uses amplitude modulated signals to display signal strength versus target range. Also known as the A-Indicator or the A/R scope. | |
AbsorptionThe retention of incident radiation by an intercepting substance. | |
AliasingAmbiguous detection in a sample data system. Aliasing occurs when the input frequency exceeds one half the sampling frequency. See also Velocity Aliasing. In radar, the folding of target returns from outside the normal unambiguous range interval (range folding) into the normal range interval, or the folding of radial velocity measurements outside the unambiguous velocity interval (velocity folding) into the normal velocity interval. | |
Aliasing ThresholdThe maximum radial velocity which a Doppler radar can unambiguously detect. See also Velocity Aliasing, Nyquist Velocity. | |
Anomalous Propagation ClutterAnomalious propagation (AP) is a mirage on a radar. Ground clutter, high superrefraction, echos beyond maximum unumbiguous range and biometeors, mountains are common AP signatures. If there are data from more than one radar, AP and false echos are easy to identify, because the neighboring radars generally won't see the same thing. If only one radar is available, it is possible to look at different elevation angles and it can be found that AP tends to be confined to the lowest elevation angles. Example Image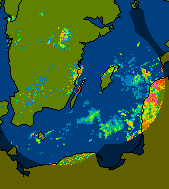 | ||
Antenna GainThe measure of effectiveness of a directional antenna as compared to an isotropic radiator, maximum value is called antenna gain by convention. | |
Antenna pointing errorAntenna of pointing error in elevation affects the H of the measurements which is in turn important for the vertical profile correction. The effect is significant at low elevations. Regular technical service of the antenna s essential to decrease antenna pointing problem. | |
AsymptoticThe condition where a line is a limit to one or more curves at an infinite distance from the origin. | |
Attenuation by precipitationThe equation dBZc = dBZ + 2CrΣ(ZE) is used for getting corrected values of attenuation by precipitation. Example Image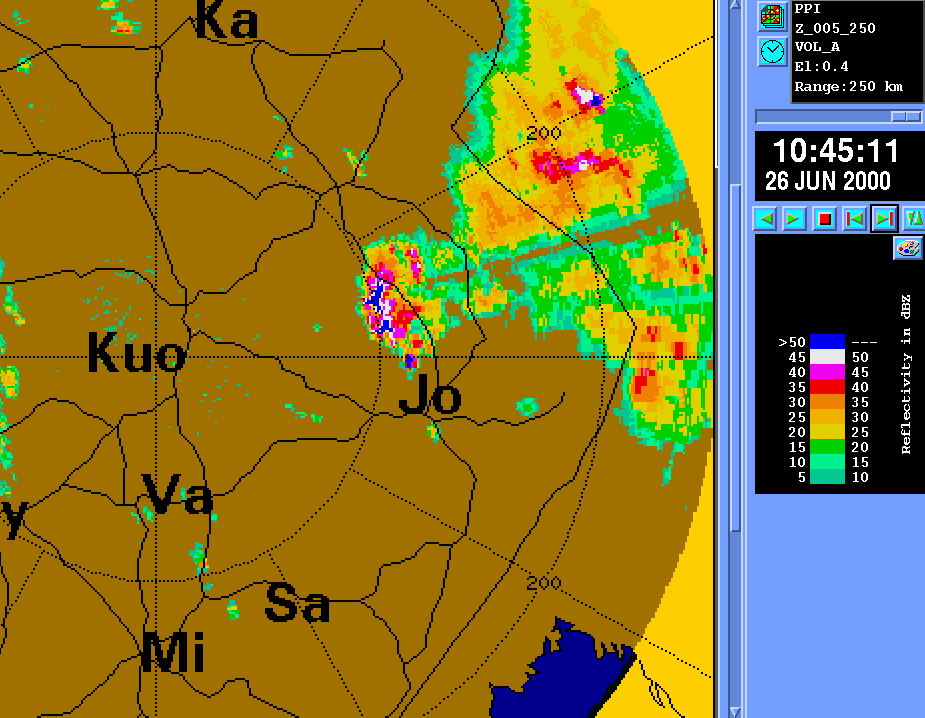 | ||
AutocorrelationA measure of similarity between delayed and undelayed (time, space, etc) versions of the same function. | |
Availability of polar dataThe problem connected with polar data is access to it. In many radar networks polar data is the lowest level potentially available. Many algorithms perform best in polar space and hence data is preferred to be available in polar coordinates. However, due to the radical changes in a data set's characteristics when transforming the set from cartesian grids, this conversion causes problems in radar data. Further improvements in data quality are expected with the international exchange of polar volume data. | ||
Away VelocityRadial component of motion away from the antenna. By convention, away velocities are expressed as positive values, usually in meters per second. | |
AzimuthA direction in terms of the 360° compass; north at 0°, east at 90°, south at 180°, and west at 270° | |
B |
|---|
BackscatterThe portion of power scattered back in an incident direction. | |
Beam propagation changesProblemsVertical profiles of temperature, pressure and humidity affect radar beam propagation, especially when there is low elevation angle at the radar site. Actually, normal propagation conditions are dominant but there are also significant seasonal variations in the median and monthly dispersion of the vertical refrectivity gradient. | ||
BirdsProblems in Radar ProductsBird flocks look like precipitation on the radar picture, especially during migration. There are some algorithms that use pattern recognition or study the doppler spectra.Example Image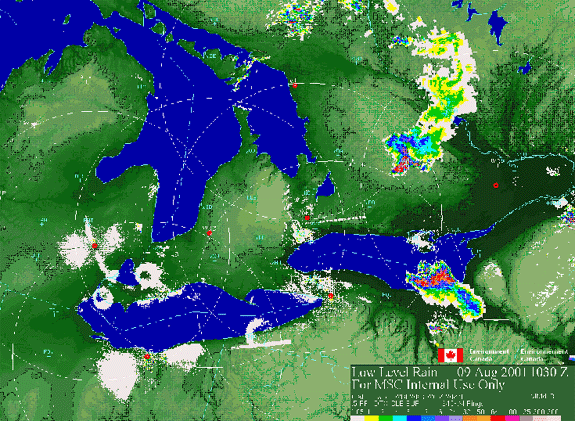 | |
Bounded Weak Echo RegionA core of weak equivalent reflectivity in a thunderstorm which identifies the location of a strong updraft. The updraft is so strong that large precipitation particles do not have time to form in the lower and mid levels of the storm and are prevented from falling back into the updraft core from above. See also Weak Echo Region. | |
Bow Echo | |
Bragg scatteringBragg scattering is the phenomenon of sharp inhomogenities in the refrective index of the atmosphere. This is most important for the radars of longer wavelength, especially those which are vertically pointed. The turbulence is responsible for producing the large-scale refractive index gradients which result in return of incident radar power. Example Image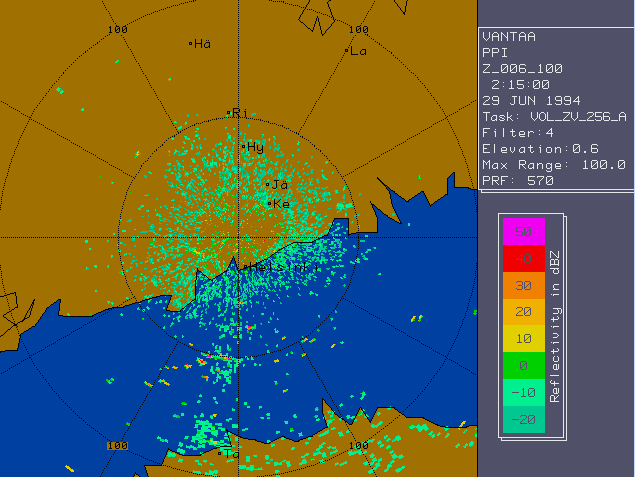 | ||
Bright bandIn radar, indicates the melting point of a snowflake. High intensity return is caused by the water surrounding the ice crystal, hence appearing large. | |
C |
|---|
C-Band RadarA radar operating in the 3900 to 6200 megahertz range whose wavelength is generally accepted as 5 centimetres. | |
CAPPIDescription2D-map containing the representative reflectivity for the horizontal plane (layer) placed at a predefined altitude. A set of maps for various heights may be given inside of the same product. Notes• The parameter filling of cones can optionally be omitted. | ||
ChaffChaff is a radar countermeasure in which aircraft or other targets spread a cloud of small, thin pieces of aluminium, metallised glass fibre or plastic, which either appears as a cluster of secondary targets on radar screens or swamps the screen with multiple returns. Modern armed forces use chaff (in naval applications, for instance, using short-range SRBOC rockets) to distract radar-guided missiles from their targets. Most military aircraft and warships have chaff dispensing systems for self-defense. An intercontinental ballistic missile may release in its midcourse phase several independent warheads, a large number of decoys, and chaff. Chaff can also be used to signal distress by an aircraft when communications are not functional. This has the same effect as an SOS, and can be picked up on radar. It is done by dropping chaff every 2 minutes.  Problems caused in weather radar productsChaff is frequently released by military aircraft during exersices. On the radar display it is usually seen as narrow bands of high reflectivity. Sometimes these chaff echoes may have a distance for hundreds of km. The width of the bands depends on the range from the radar and the amount of diffusion time.Example Image 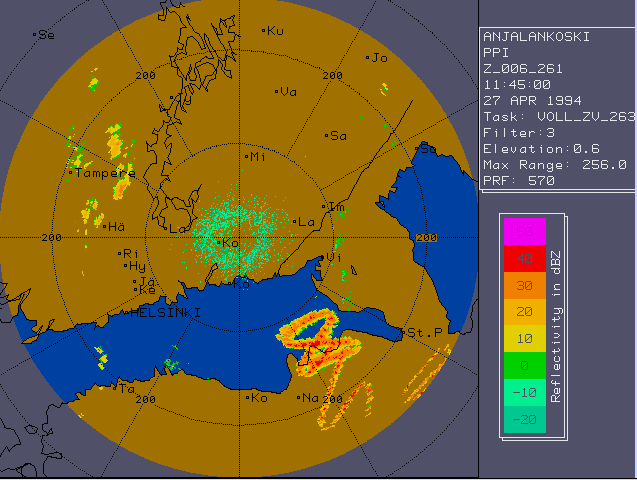 | |
Circular PolarizationElectromagnetic radiation in which the electrical field rotates uniformly about the direction of propagation. The effect is to reduce return signals from spherical targets, which eliminates some precipitation targets from the radarscope. Usually found on Air Traffic control radars. | |
Clear air echoRadar returns from cloud and precipitation-free (optical clear) air. Clear-air echos are caused by Bragg scatter and insects. Bragg scatter comes from small-scale fluctuations of the refractive index (i.e. turbulent fluctuations of humidity). | ||
Coherent RadarA radar, such as a pulse Doppler, in which phase of the transmitted energy is preserved for comparison with the phase of returned energy to determine target motion. | |
Coherent SignalA signal which contains information in both its phase and amplitude. | |
Constant altitude reflectivity2D-map containing the representative reflectivity for the horizontal plane (layer) placed at a predefined altitude. A set of maps for various heights may be given inside of the same product. Notes• The parameter filling of cones can optionally be omitted. | |
D |
|---|
DealiasingProcess of removing undesirable aliases from the velocity field, i.e. the correction of the process of aliasing. | |
DecibelAn logarithmic expression for ratio of two quantities. dBm is a decibel with respect to 1 milliwatt. Mathematically: dB = 10 log (P1/P2) dBm = 10 log (P/10-3) dBZ = 10 log (Ze) | |
Depolarization ratioRatio between the reflectivity received at vertical polarization, but transmitted with horizontal polarization, and the reflectivity at horizontal polarization. Depolarization of the horizontal polarized pulse is caused by asymmetric particles which are not aligned horizontally. Depolarization of rain is normally very small (app. -40 dB). It is high (-20 to -10 dB) for melting snow and water coated hail or graupel. | ||
Differential Phase Shift φDPDescriptionDifferential phase shift φDP is the phase shift between the horizontally polarized wave and the vertically polarized wave.Notes• Since φDP is not affected by attenuation, it can be used to develop and check attenuation correction schemes.• Attenuation correction based on using the total Differential Phase Shift as a constraint is selectable for reflectivity products. Reflectivity products can be viewed with or without attenuation correction. Correction of Differential Reflectivity due to differential attenuation is also available. | ||
Differential reflectivityRatio between the reflectivity of a horizontal polarized pulse and the reflectivity of a vertical polarized pulse. ZDR depends on the asymmetry of the shape, the orientation and the falling behaviour of the particles. ZDR is positive for oblate raindrops, zero or slightly negative for hail and graupel. Note that ZDR is strongly biased by differential attenuation during the passage of the radar pulse through heavy rainfall. | ||
Display ResolutionThe area or two-dimensional product of the X and Y coordinates represented by one picture element (pixel) of a raster scan display. | |
DistortionUndesired change in a signal resulting in unfaithful reproduction of video or audio. | |
Doppler DilemmaThe interdependence of maximum unambiguous range and maximum unambiguous velocity on the pulse repetition frequency, PRF. As PRF is increased (decreased), the range of unambiguous velocities increases (decreases), but the unambiguous range decreases (increases). | |
Doppler EffectChange in observed frequency of wave energy due to relative motion of the observer and wave source. | |
Doppler Radar | |
Doppler velocityReflectivity-weighted average velocity of targets in the pulse volume. Determined by phase measurements from a large number of successive pulses. Also called radial velocity. Gives only the radial component of the velocity vector. It is generally assumed that raindrops and other particles are advected with the wind and have no own motion except their falling velocity. Motion towards the radar are negative (blue colours), motions away from the radar are positive (red colours). | |
DuctA rather shallow layer in the atmosphere through which vertical temperature and moisture gradients trap the radiating energy enabling the radar to detect targets at abnormally long ranges. | |
Dynamic RangeThe ratio, usually expressed in decibels of maximum to the minimum signal which a system can handle. Most frequently used to describe limits of receivers or cathode ray tubes. | |
E |
|---|
Echo base altitudeDescriptionThe echo base product provides for each point on the surface, an estimate of the height of the lowest elevation of the first echo return that is above a reflectivity threshold. ParametersProduct data quantity: altitudeImage size: number of pixels per row (# of columns) and per column (# of rows) Pixel size: horizontal and vertical extension of the pixel in km Reflectivity threshold: value in 0.1 dBZ Level slicing method: list of values in 0.1 km a.s.l. or formula parameters (see section 7 in WD21_99) Notes• In areas where precipitation reaches ground or lowest measurement bin, this product shows undefined values.• The quality of this product depends crucially on number of elevations in the polar volume. | ||
Echo top altitudeDescription2D-map containing the highest altitude reaching a predefined reflectivity threshold inside the vertical column over each surface point. ParametersProduct data quantity: altitudeImage size: number of pixels per row (# of columns) and per column (# of rows) Pixel size: horizontal and vertical extension of the pixel in km Reflectivity threshold: value in 0.1 dBZ Level slicing method: list of values in 0.1 km a.s.l. or formula parameters (see section 7 in WD21_99) Example image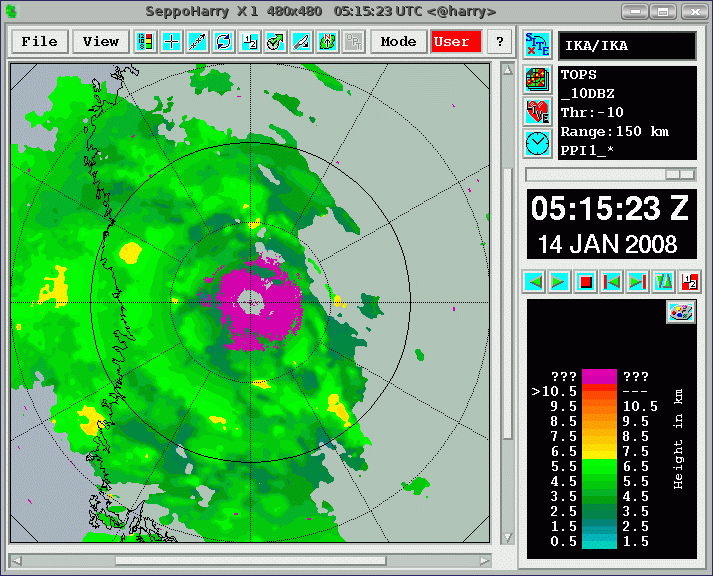 | ||
ElevationThe vertical pointing angle of the antenna; 0° is horizontal, 90° is vertical. | |
Equivalent Radar ReflectivityAKA Ze. The concentration of uniformly distributed small (diameter one sixteenth wavelength or less) water particles which would return the amount of power received. Typically expressed as: dBZ = 10 log Ze. | |
F |
|---|
Flare echoFlare echo is caused by the reflection of large hail in the mid levels of the storm. Radar scatters radiation toward the ground, after that it scatters back to hydrometeors, which then scatter some of the radiation back to the radar. | |
FrequencyThe number of recurrences of a period phenomenon per unit time. Electromagnetic energy is usually specified in hertz (Hz), which is a unit of frequency equal to one cycle per second. | |
G |
|---|
GainA change in signal power, voltage or current. Usually applied to a change greater than one and expressed in decibels. | |
Gauge adjustmentGauge adjustment is a solution to problems connected with range effects, calibration level, and limited extent effects. Gauge adjustment is any procedure that makes partial changes in the characteristics of radar data in order to correspond radar derived measurements to the results given by gauge measurements. | |
GrassThe pattern produced as random intensity fluctuations on an A-scope, usually caused by noise. It appears as closely spaced, sharp, time varying pulses. | |
Ground clutter | ||
H |
|---|
Hail productDescriptionUses volumetric data to determine the probability of hail. These data consists of Vertically Integrated Liquid (VIL), the Melting Level, Zonal (East-West component) wind Velocity and average Relative Humidity (0 to 500 mb). The probability is determined for each column of bins within VIL in the area of surveillance and mapped in the Hail Probability Product. ParametersUpper limit: kmLower limit: km Humidity: % Melting level: km Zonal wind at 500 mb: m/s Range: km Notes• Z/W relationships is used for VIL• The upper and lower limits are the heights above and below which data in the data volume are not considered for the VIL calculation | ||
Hail SignalDescriptionThe Hail Signal product exploits the inherent differences in the radar signatures of rain and hail. Raindrops maintain predominately regular, oblate spheroid shapes as the fall to the earth. Hail stones, however, are irregular in shape and tumble as they fall to the earth. The Zdr for rain is generally positive but may range from 0 to 4 dB whereas the Zdr for hail is generally 0 dB. ParametersUpper limit: kmLower limit: km Range: km Notes• The upper and lower limits are the heights above and below which data in the data volume are not considered for the for the hail signal product | |
Height of Maximum IntensityDescription2D-map containing the altitude of highest reflectivity value inside the vertical column over each surface point. ParametersProduct data quantity: altitudeImage size: number of pixels per row (# of columns) and per column (# of rows) Pixel size: horizontal and vertical extension of the pixel in km Level slicing method: list of values in 0.1 km a.s.l. or formula parameters (see section 7 in WD21_99) (Optional: Reflectivity threshold: value in 0.1 dBZ ) Notes• In stratiform rain, the product can be used to determine the height of bright band (melting layer). However, if there is no melting layer, it will show a value inside of an ice cloud. To avoid such problems, an optional threshold could be used (show only product for pixels where maximum intensity is over a dBZ threshold.)• Rapidly decreasing heights in convective storms may indicate the presence of a microburst. • The quality of this product depends crucially on number of elevations in the polar volume, even more than in other products, as it is not possible to interpolate the maximum. | ||
Hydrometeor classificationDescriptionHydrometeor classification products are based on reflectivity and on the dual polarization variables differential reflectivity, specific differential phase, correlation coefficient and the linear depolarization ratio. Dual-channel measurements are used to deduce the types of scatterers present in the atmosphere, such as rain, hail, snow, graupel and even non-meteorological targets such as insects, chaff and clutter. Parameters• dBZh , dBZv, ρ hv, φDP, ZDR, LDR | ||
I |
|---|
Index of RefractionRatio of velocity of electromagnetic energy in a vacuum to that in a specified medium. | |
Insects | |
Isodop | |
Isotropic RadiatorA radiator which transmits equal energy in all directions. | |
K |
|---|
Kalman FilterA linear system in which the mean squared error between the desired output and the actual output is minimized when the input is a random signal generated by white noise. | |
KlystronAn electron tube used as a low power oscillator or a high power amplifier at ultrahigh frequencies. Used for exceptional stability over long periods of transmission. | |
L |
|---|
Layer Mean ReflectivityThe layer mean reflectivity is a 2D-map showing the mean reflectivity in a user-defined layer between two CAPPI surfaces. | |
Layer turbulenceDescription2D map containing the mean spectral width between set upper and lower limits in altitude in the vertical column over each surface point (ground view) LTB is calculated using a polar volume data set with spectral width as input. ParametersRange: diplayed rangeImage size Pixel resolution Top: Height above MSL of upper data layer Bottom: Height above MSL of lower data layer NotesLTB can be used to observe turbulence on flight levels. The radar scan should be optimized for this purpose, low antenna rotation speed to get a good enough data set of W. | ||
Linear depolarisation ratioDescriptionThe linear depolarization ratio LDR is the ratio of the vertically polarized reflectivity to the horizontally polarized reflectivity for a horizontally polarized transmitter pulse, in other words: the ratio of the cross-polarized reflectivity to the co-polarized reflectivity. Notes• Measurement needs usually different radar measurement mode. | ||
Linear PolarizationThe polarization of a wave radiated by an electric field vector that does not rotate but alternates so as to describe a line. Normally, the vector is orientated either horizontally or vertically with respect to the earth. | |
M |
|---|
MagnetronAn electron tube used as a high power oscillator in the microwave bands. This produces pulse to pulse variations that make it unstable for Doppler radar use. | |
Main lobeThe envelop of electromagnetic energy along the main axis of the beam. | |
Maximum Unambiguous RangeThe greatest distance a pulse can travel and return before the next pulse is transmitted. Ru = C / (2*PRF) | |
Maximum vertical reflectivityDescription2D map containing the maximum reflectivity present in the vertical column over each surface point (ground view). In addition and optionally, the maximum reflectivity taken along a set of horizontal planes at different altitudes and along specified directions can be given (side-walls). Notes• It is assumed that the level slicing used for the side-walls intensity is the same than for the ground map.• For side-walls, if the height increment is constant then the vertical spacing is given instead of specifying the sequence of height values. • If side-walls are present, then their number, orientation and height sequence are omitted. Example image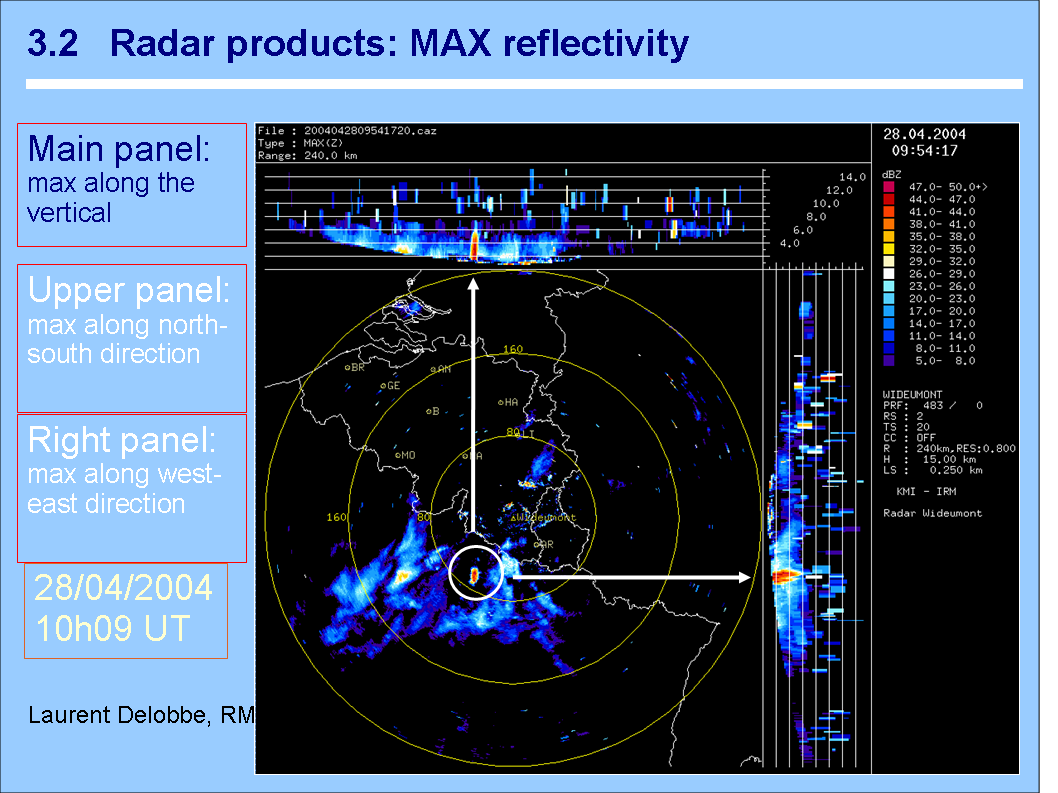 | |
Mean Doppler VelocityReflectivity weighted average velocity of targets in a given volume sampled. Usually determined from a large number of successive pulses. Also called mean radial velocity. | |
Minimum Discernable SignalA.K.A: MDS. In a receiver, the smallest input signal that will produce a detectable signal at the output. This value is a measure of receiver sensitivity. | |
MiscalibrationMiscalibration influences compositing and produces biases in the rainfall rate estimates. It is difficult to correct precipitation attenuation because of it. An overestimate of Z produces an exponentially increasing error. Example Image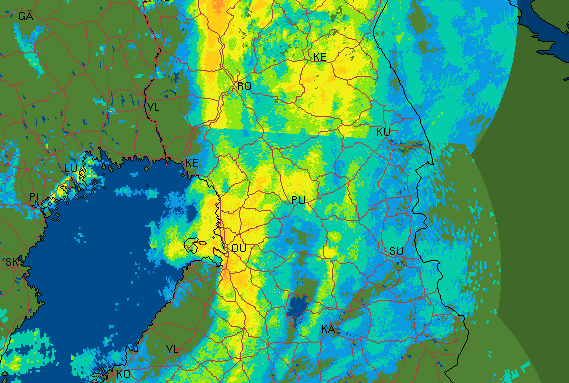 | |
Monostatic RadarA radar system in which the same antenna is used for transmission and reception of energy. | |
Multiple Doppler wind barbsDescription2D-array of horizontal wind vectors, based on measurements of two doppler radars located typically less than 100 km from each other. . ParametersProduct data quantity: array of speed (tenths of m/s and direction (degrees) of windImage size: number of arrays per row (# of columns) and per column (# of rows) Coordinates of central point of the image Array spacing: km Upper limit altitude: m a.s.l. Lower limit altitude: m a.s.l. Maximum unambigious speed Unfolding method used Fallspeed correction method used if any Notes• The barbs cannot be used at area where the beams of the two radars are almost parallel. From this and other reasons, a quality indicator is essential. | ||
Multiple Trip EchoesSignal returns from a pulse other than the most recent. See also Range Folding. | |
N |
|---|
Nyquist VelocityWhen the radial component of target velocity exceeds one half wavelength (or 180 degrees) the measurement of the phase change between transmitted and received pulses is ambiguous. This results in radial velocity which is aliased. The velocity at which this occurs is the Nyquist Velocity. VN = PRF*λ/4 | |
O |
|---|
Operational ModeA combination of scanning strategies and product mixes tailored to one or more meteorological situations. | |
Orographic enhancementThe precipitation process can be enhanced by the seeder-feeder mechanism. Convective cells aloft can produce large precipitation particles, falling through a lower cloud layer and growing at the expense of the water content at the lower cloud. | |
Overhanging emittersRadar pictures get infected by microwaves coming from other radars and microwave links. Most of the emitters can be discovered by pattern recognition from polar data. Example Image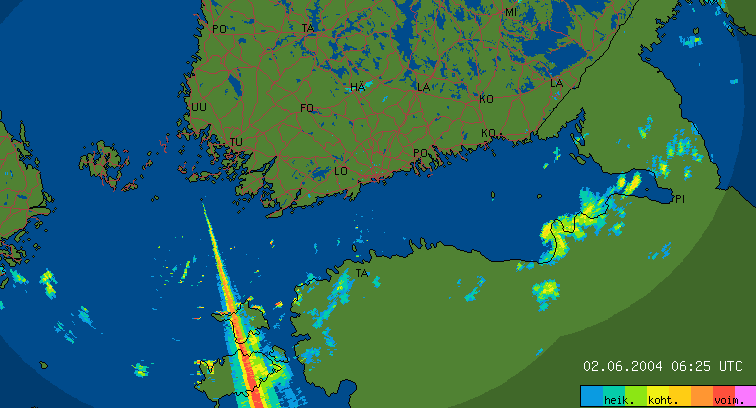 | ||
Overhanging precipitationSometimes precipitation evaporates before hitting the ground. Surface station data and NWP data can be used to recognize and correct this fact. Sometimes this operation is the part of the vertical profile correction. Example Image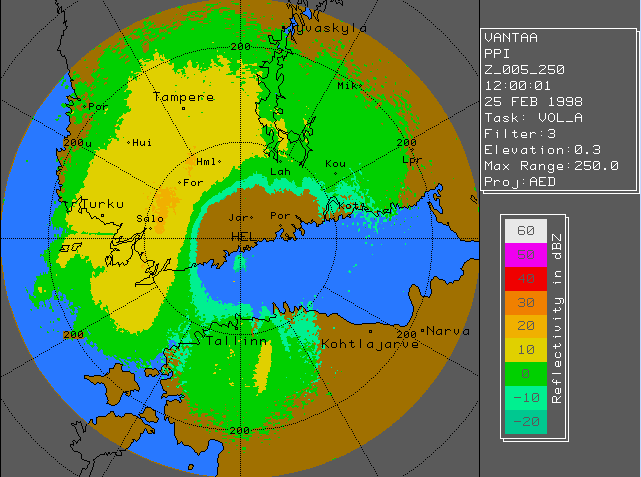 | |
OvershootingFailure to detect a target because the radar beam is too high. | |
P |
|---|
PhaseA particular stage or point of advancement in a cycle; the fractional part of the period through which time has advance, measured from some arbitrary origin. | |
Phase ShiftThe angular difference if two periodic functions have the same angular velocity. | |
Plan position indicatorDescriptionDisplay on which radar signals are shown in plan position with range and azimuth angle displayed in polar coordinates, forming a map-like display.The PPI is a 2D-map projection of a conical surface at predefined elevation containing either reflectivity, precipitation intensity, the radial component of wind velocity or one of the dual polarization parameters. A Polar volume consists of many PPIs. A set of PPIs for various elevations may be given inside of the same product, but they all must contain the same product data quantity. Notes• PPI of velocity can be used as input for dual Doppler products• For dual pol parameters other optional parameters... | ||
Polarimetric correlation coefficientDescriptionThe Polarimetric Correlation Coefficient ρhv provides the complex correlation between the horizontally and the vertically polarized signals. Notes• The ρhv data is a useful indicator describing the regularity or irregularity, shape and canting angles of hydrometeors. | ||
PolarizationThe direction of the electric vector in a field of electromagnetic energy. | |
PropagationMotion of electromagnetic energy as waves through or along a medium. | |
PulseA single short duration transmission of electromagnetic energy. | |
Pulse DurationLinear distance in range occupied by a burst of transmitted radio energy. This may also be expressed in units of time. Also called pulse length or pulse width. | |
Pulse LengthThe linear distance in range occupied by an individual broadcast from a radar. Also called the pulse width. | |
Pulse Pair ProcessingNickname for the technique of mean velocity estimation by calculation of the signal complex covariance argument. The calculation requires two consecutive pulses. | |
Pulse Repetition FrequencyThe number of broadcasts by a radar per unit time. A.K.A: PRF | |
Pulse Repetition TimeThe time elapsed between successive broadcasts by the radar. Also called Pulse Interval. A.K.A: PRT | |
R |
|---|
Radar sitingNational radar network consists of many radars located all over the country. The radar horizon should be unobscured to the extent possible determined by the local orography. If the surface of the country is flat, one can avoid blocked sectors and find a location not far from optimal. In mountaneous regions unobscured locations are found only on mountain tops; such a location location is nevertheless problematic for many reasons. Locations at airports should be also avoided to be able to provide best service to aviation customers. Example Image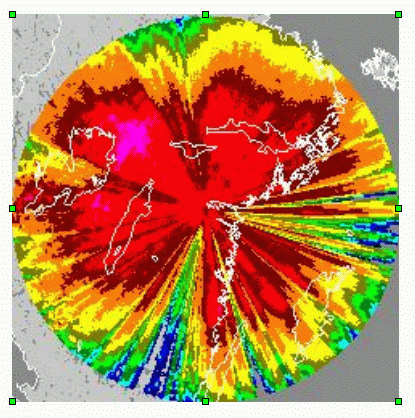 | ||
Radial VelocityComponent of target motion parallel to the beam axis. Also known as Doppler velocity. | |
Rainfall rate estimation | ||
Range binDiscrete element along a single radial of radar data at which the received signals are sampled. Range bins from POLDIRAD data are spaced at multiples of 150 m intervals. See also sample volume. | ||
Range FoldingApparent range placement of a multiple return. A multiple return appears at the difference of the true range and a multiple of the unambiguous range. | |
Range Height IndicatorDisplay on which radar signals are shown with height as the vertical axis and range as the horizontal axis, forming a vertical cross section of a cloud or precipitation system. | ||
Range NormalizationA receiver gain function which compensates for the effect of range on the received power for an equivalent reflectivity. | |
Range ResolutionAbility of the radar to distinguish two targets along the same radial, it is approximately one half the pulse length. | |
Rayleigh ScatteringChanges in direction of electromagnetic energy by particles whose diameters are 1/16 wavelength or less. | |
Reflectivity factorIntegral over the backscatter cross-section of the particles in a pulse volume. For particles small compared to the wavelength the scatter cross-section is D6, where D is the diameter of the particle. Radars are calibrated in the way to give directly (assuming the dielectric constant of water) the reflectivity factor from the received backscattered energy. Units for the reflectivity factor are mm6 m-3 or the logarithmic value of this in dBZ. | |
RefractionChanges in the direction of energy propagation as a result of density changes within the propagating medium. | |
S |
|---|
S-Band RadarA 10 centimetre wavelength radar. | |
Sample volumeThe volume in which the radar data for one range bin are measured. Defined by the width of the radar beam (app. 1°) and half the length of the transmitted pulse. 1 µs pulses are 150 m deep, 2 µs pulses are 300 m deep. | ||
SaturationUpper limit of dynamic range above which an increase in the input signal produces no detectable change in the output. | |
Scanning StrategyA volume scanning procedure designed for the surveillance of one or more particular meteorological phenomena. | |
Sea clutterSea clutter is a specific form of spurious echo feature. The main reason of its formation is anomalous propagation of partial radar beam above water bodies, i.e. ducting. Sea clutter can be treated by identifying multiple modes of the reflictivity spectrum and then treating each mode differently. Example Image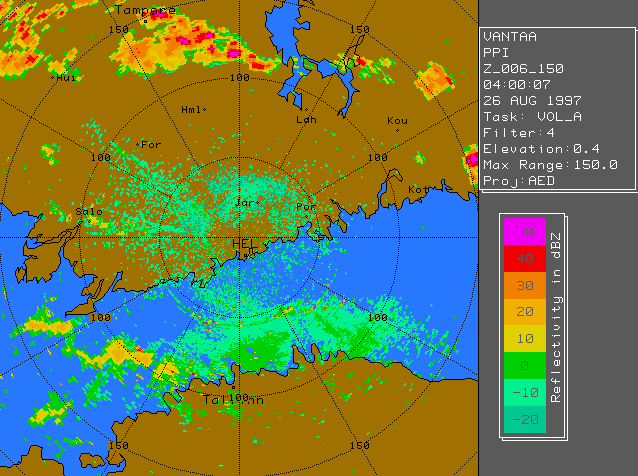 | ||
Second trip echoProblems caused in radar productsSecond trip echos appear much weaker than real echos. Problem exists when PRF is big (thus rmax is small), and strong reflectivities appear high in the troposphere. SQI threshold removes second trip echos, because they are incoherent, but in this case we can lose valuable information.Example Image | |
Ships in radar imagesProblems caused in radar productsDoppler filter is useless when sidelobes hit the ship because of the movement of the ship. Ships and their sidelobe echos can be detected and removed using pattern recognition methods to polar data.Example Image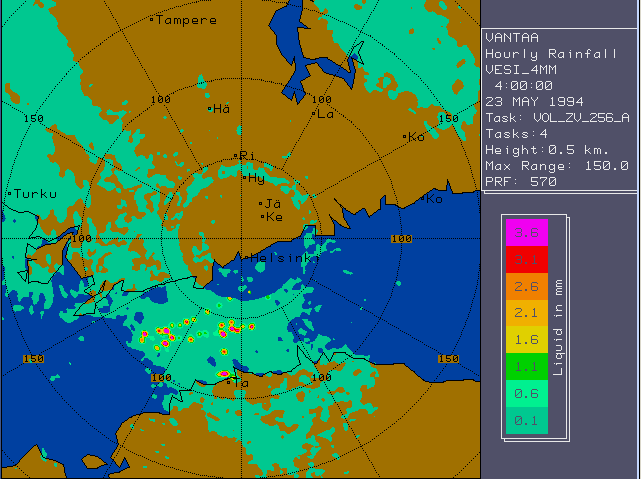 | |
Side LobeSecondary energy maximum located outside the radar beam. Typically contains a small percentage of energy compared to the main lobe. | |
Sidelobe echoProblems caused in radar productsSecondary maxima of radar beam is called sidelobes. Echos caused by sidelobes are seen in wrong directions. Typically sidelobes are much weaker than the main one. So the problem exist if only it is very strong echo (hail, ship, ground clutter).Example Image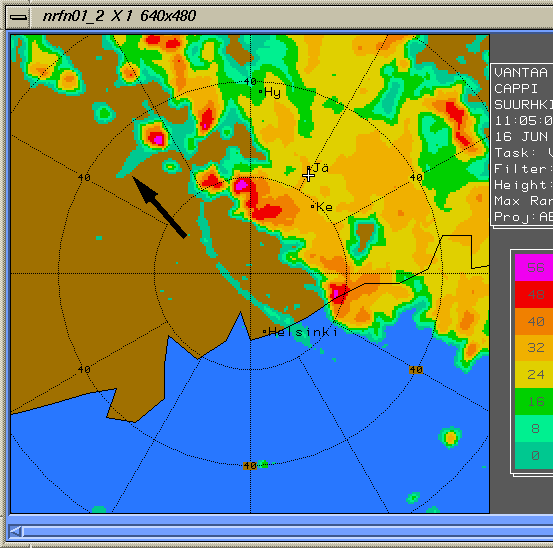 | |
Specific differential phase shiftDescriptionThe Specific Differential Phase KDP denotes the difference between the propagation constant for the horizontally and vertically polarized wave. In a homogeneous medium KDP can be directly obtained from the differential phase shift φDP at two different locations. Notes• KDP is only affected by anisotropic hydrometeors (rain) and therefore KDP allows to discriminate between rain and frozen precipitation. | ||
Spectral widthA measure of the dispersion of velocities within the pulse volume. Standard deviation of the velocity spectrum. Spectral width depends among others from the turbulence within the pulse volume. | |
Spectrum at Maximum VelocityDescriptionVisualisation of areas with high velocity and high spectrum width (potential risk For air traffic). No height information given. V and W must be scanned together to make this product. ParametersRangeImage size Height (top and bottom) | ||
Specular reflectionsSpecular reflections may be caused by radiowaves reflected by water surface or windows/buildings. Direction of the reflected radiowaves is determined by the incidence angle. Specular reflections may cause problems for both reflectivity and velocity measurements as the direction of the radar beam is changed. Example Image 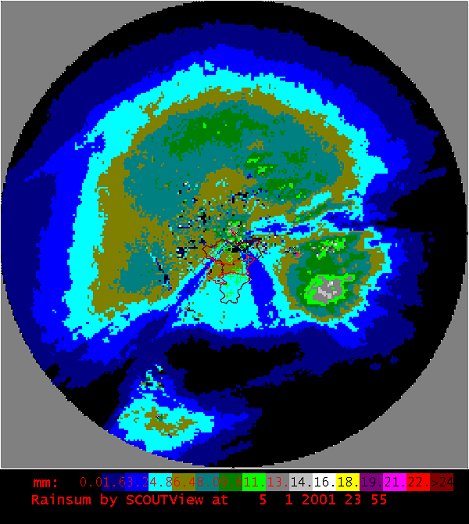 | |
Storm Relative VelocityShows local radial velocity values relative to a moving storm. Can be aplied on polar volume data of radial velocity. | ||
Suboptimal compositing algorithmsThere are several different principles of choosing the data (compositing algorithm). Problems related to cartesian products cause information loss or bias, thus quality indicator fields are necessary when calculating the optimal values of data from two or more radars. There are principles of data selection based on
All of them have some problems. Most problmetic is the approach related to averaging. Information on elevation angles and radar heights should be available to use any of these principles. One possible solution is based on generating a so called seek matrix, which is in essence a pointer table. The advantage of this method is the fast pace of getting information, but is suitable for supercomputers only due to the considerable amounts of memory required by the matrix and data. | ||
SubrefractionBending of the radar beam in the vertical which is less than under standard refractive conditions. This causes the beam to be higher than indicated, and leads to underestimation of cloud heights. | |
Sun echoProblems caused to radar productsRadar receives 5 cm microwaves from the sun, which are seen mostly when the sun is near the horizon. Thus the problem is mostly encountered in higher latitudes than elsewhere.Example Image 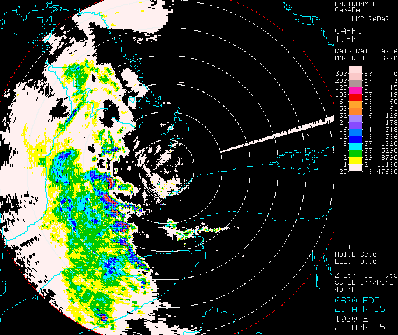 | |
SupercellA relatively long-lived storm possessing all of the following characteristics: rotation, with a high correlation between horizontal vorticity and updraft strength; existence of a BWER and/or hook echo; and a continuous mode of propagation (appears to be a steady state system). This storm type is typically associated with the most intense tornadoes and largest hailstones. | |
SuperrefractionBending of the radar beam in the vertical which is greater than under standard refractive conditions. This causes the beam to be lower than indicated, and often results in extensive ground return as well as an overestimation of cloud top heights. | |
Surface precipitation accumulationDescription2D-map with the precipitation estimates at surface level accumulated during a predefined period of time. ParametersProduct data quantity: precipitation amountImage size: number of pixels per row (# of columns) and per column (# of rows) Pixel size: horizontal and vertical extension of the pixel in km Level slicing method: list of values in 0.1 mm or formula parameters (see section 7 in WD21_99) Adjustment method: None, Radar-to-gage factors (RT or CL), Gage-tuned Z-R relationship (RT or CL), Radar-to-gage regression (LL or NL or RT or CL), Vertical profile (SY or RE) Accumulation period: in minutes Accumulation method: Sampling-and-hold or Interpolation Notes• RT: real-time,• CL: climatological, • LL: linear, • NL: non-linear, • SY: synthetic, Example Image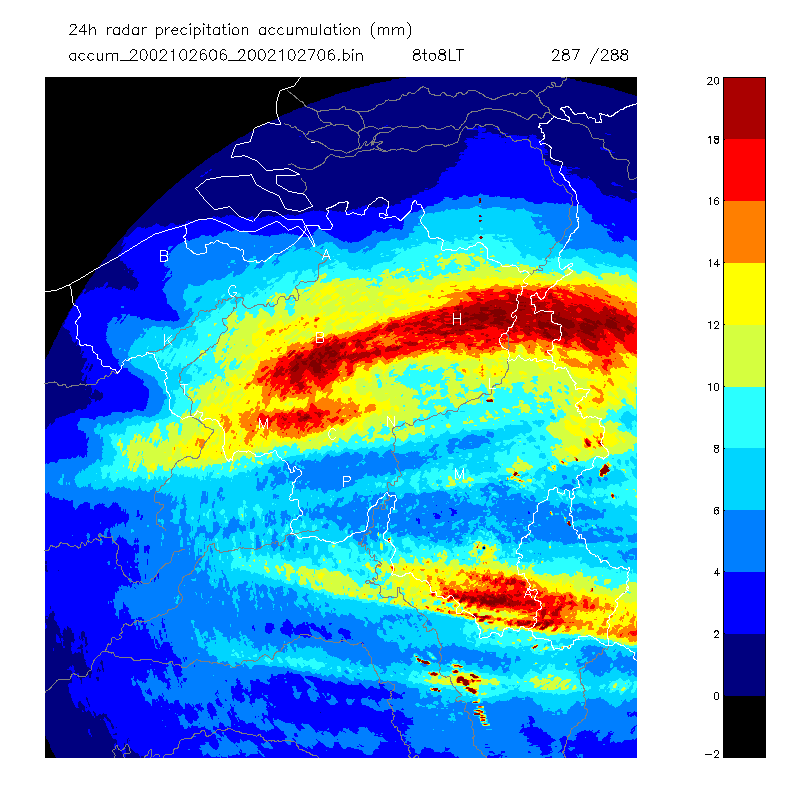 | |
T |
|---|
Thin Line EchoA narrow elongated non-precipitating echo usually associated with thunderstorm outflow, fronts, or other density discontinuities. | |
Total beam overshootingTotal beam overshooting influences the range limit of a radar. The range limit depends on the elevation angle of the radar and cloud top height. Sitting the radar to place will give a lower elevation angle. Example Image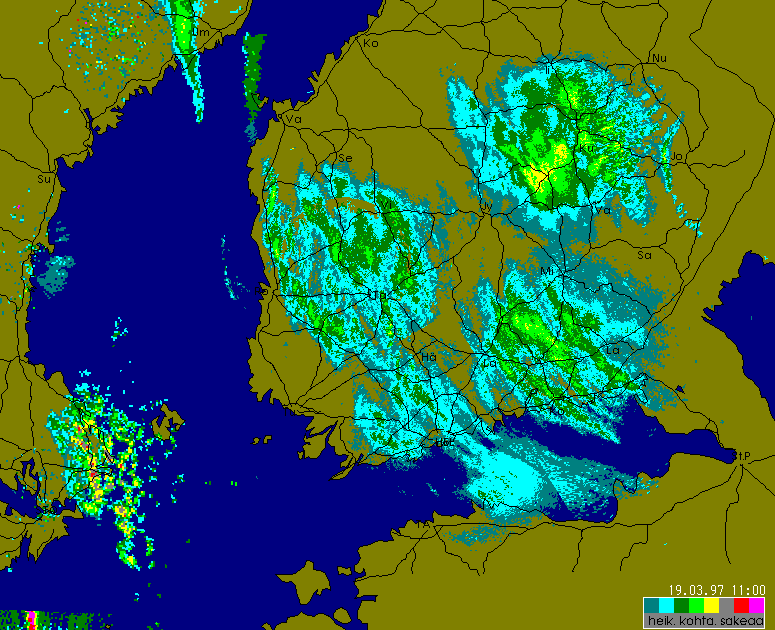 | ||
Toward VelocityRadial component of velocity toward the antenna. By convection, toward velocities are expressed as negative values usually in meters per second. | |
V |
|---|
VADThe VAD (Velocity Azimuth Display) technique is used to retrieve the vertical wind profile at the radar site with a Doppler radar. PPI scans at an elevation of about 20° cover various heights with one scan. | ||
Velocity AliasingAmbiguous detection of radial velocities outside the Nyquist Interval by Doppler Radar. | |
Vertical reflectivity profileDescriptionRadar product giving the vertical profile of the reflectivity taken over a specified surface area. For each height level this product delivers a set of parameters that describes the reflectivity field inside the considered volume. The Vertical profile of reflectivity is the main factor in the accurancy of precipitation measurements at distances of 50-250 km. The origins of large bias of 2-20 dB are based on the difference between the actual reflectivity of ground level and in the contribution volume aloft. Notes• The profile is taken in a vertical cylinder based above a ground area of specified form and position. Typically it is taken within a circular area centred around the radar station. If this is not the case (e.g. for an arbitrary form) the surface is described by its gravity centre and equivalent radius.• The data quantification method describes the algorithm used to associate a reflectivity value to an height level. "When the vertical stratification is not regular the sequence of the used heights is to be specified. • The base area and the quantification method can optionally be omitted. Example Image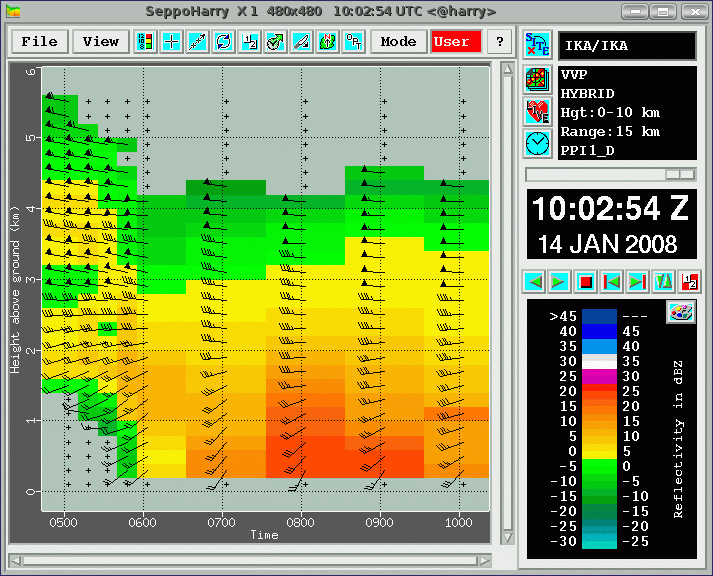 Time series of vertical profiles of reflectivity and wind | |
Vertical wind profileDescriptionRadar product with the vertical profile of the wind estimated from Doppler measurements above the weather radar station. For each height level this product gives a set of parameters describing the wind field. ParametersVertical spacing: height difference between successive samples in mVertical range: range of considered altitudes (lowest, upper) in 0.1 km a.s.l. Volume shape: Cylindrical, Conical, ... Quality information: (OK or suspect or not-applicable or missing) Product data quantity for each height level: horizontal and vertical velocity in 0.1 m/s and direction in degrees Notes• Detailed information is present in documents OPERA 22-1/99 and 22-2/99. "• When the vertical stratification is not regular the sequence of the used heights is to be specified. " • The volume shape can optionally be omitted. Example Image | ||
Vertically Integrated LiquidDescription2D map containing the integrated liquid water content between set upper and lower limits in altitude in the vertical column over each surface point. ParametersProduct data quantity: W (intergrated liquid water content)Unit: mm Upper limit altitude: km Lower limit altitude: km Z/W relationship used Optional: height of melting layer Image size: number of pixels per row (# of columns) and per column (# of rows) Pixel size: horizontal and vertical extension of the pixel in km Level slicing method: list of values or formula parameters (see section 7) Level slicing unit: mm Notes• Z/W relationships are different for snow and water• The bright band biases VIL results, so the top and bottom should be either above or below melting layer altitude. | ||
Volcanic ashProblems caused to radar productsVolcanic ash has different dielectric characteristics from liquid water and ice but ash and soot from forest fires and/or volcanic eruptions can still be detected by weather radars.Example Image 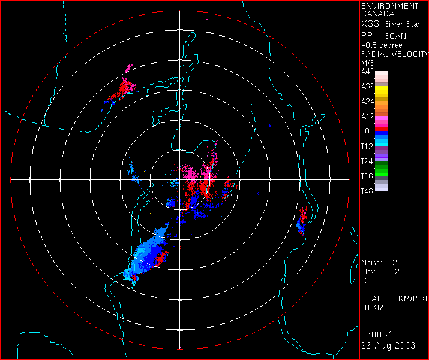 | ||
Volume ScanThe process of completing a series of antenna rotations at specified elevation angles. | |
W |
|---|
Water phaseProblems found in Radar productsRadar reflectivity depends on diameter and dielectricity of the particles. To derive the equations Z(R) (rain) and Z(S) (snow), the water phase must be known. It is possible to know it from VPR analyses and external temperature data sources such as NWP, soundings, weather stations and dual polarization radars. | |
Weak Echo RegionWithin a convective echo a localized minimum of equivalent reflectivity, often associated with the strong updraft region. | |
Wet radome attenuationMicrowaves lose energy on a wet radome. Rain attenuation could be reduced by hydrophobic coating. The attenuation could be estimated by ground clutter echos, if target is not too far. Example Image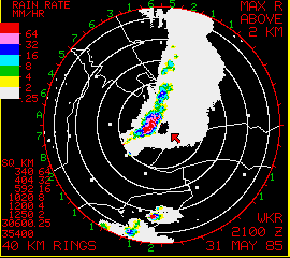 | ||
Wind shearDescription2D-map projection of a conical surface at predefined elevation containing change of the radial component of wind in Radial, Azimuthal or elevational direction or combined. ParametersProduct data quantity: wind shear in tenths of m/s/kmRadial, Azimuthal or elevation shear, or combined R+A, R+A+E, etc. Notes• The radial velocity data should be of high quality because of danger of false alarms. | ||
Wind speed and directionDescription2D-array of horizontal wind vectors, based on single Doppler radar measurements and eg. the uniform wind algorithm. ParametersProduct data quantity: array of speed (tenths of m/s and direction (degrees) of windImage size: number of arrays per row (# of columns) and per column (# of rows) Array spacing: km Upper limit altitude: m a.s.l. Lower limit altitude: m a.s.l. Range and Azimuth Spacing: These fields define the resolution of computing the wind vectors in polar coordinates. Quality indicator: Ref. WP 1.2 Notes• Because vertical shear can be substantial, it is recommended that the layer between upper and lower limit should be around 1 km• A quality indicator should be defined for this! | ||
WindmillsProblems caused to radar productsWindmills cause partial beam blockage. Beam blockage in turn causes a reduction in the quality of the surface precipitation estimates. The beam blockage can be estimated by considering the ratio of the intercepting area of the windmill and the local area of the radar beam. | |
