Radar Meteorology Glossary
Special | A | B | C | D | E | F | G | H | I | J | K | L | M | N | O | P | Q | R | S | T | U | V | W | X | Y | Z | ALL
S |
|---|
S-Band RadarA 10 centimetre wavelength radar. | |
Sample volumeThe volume in which the radar data for one range bin are measured. Defined by the width of the radar beam (app. 1°) and half the length of the transmitted pulse. 1 µs pulses are 150 m deep, 2 µs pulses are 300 m deep. | ||
SaturationUpper limit of dynamic range above which an increase in the input signal produces no detectable change in the output. | |
Scanning StrategyA volume scanning procedure designed for the surveillance of one or more particular meteorological phenomena. | |
Sea clutterSea clutter is a specific form of spurious echo feature. The main reason of its formation is anomalous propagation of partial radar beam above water bodies, i.e. ducting. Sea clutter can be treated by identifying multiple modes of the reflictivity spectrum and then treating each mode differently. Example Image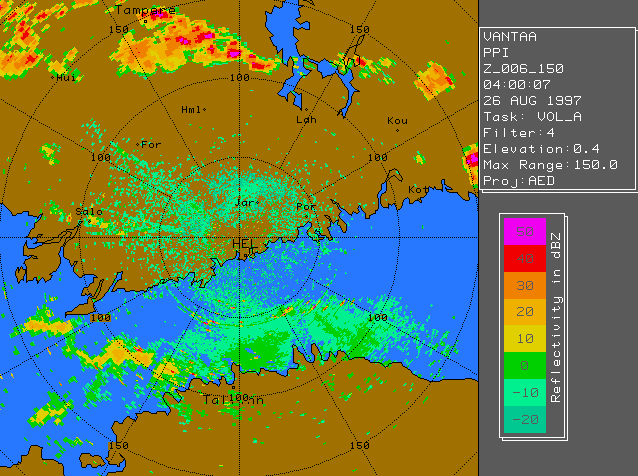 | ||
Ships in radar imagesProblems caused in radar productsDoppler filter is useless when sidelobes hit the ship because of the movement of the ship. Ships and their sidelobe echos can be detected and removed using pattern recognition methods to polar data.Example Image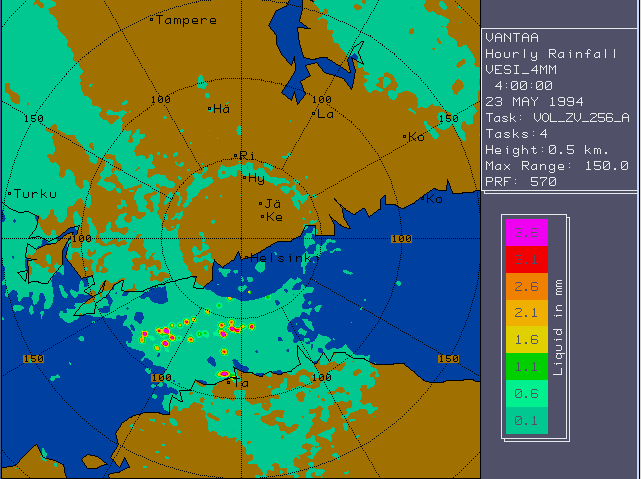 | |
Side LobeSecondary energy maximum located outside the radar beam. Typically contains a small percentage of energy compared to the main lobe. | |
Sidelobe echoProblems caused in radar productsSecondary maxima of radar beam is called sidelobes. Echos caused by sidelobes are seen in wrong directions. Typically sidelobes are much weaker than the main one. So the problem exist if only it is very strong echo (hail, ship, ground clutter).Example Image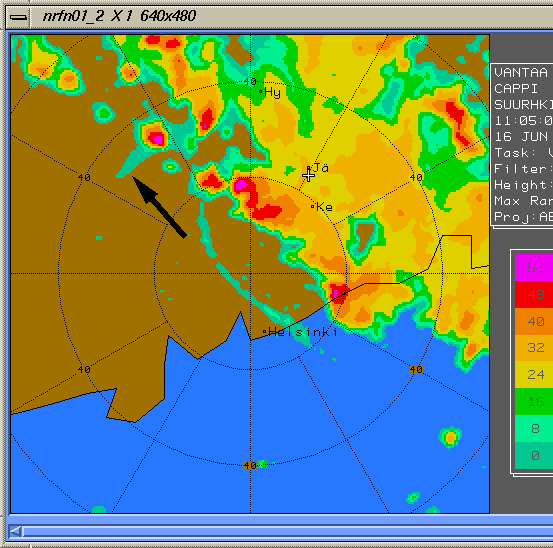 | |
Specific differential phase shiftDescriptionThe Specific Differential Phase KDP denotes the difference between the propagation constant for the horizontally and vertically polarized wave. In a homogeneous medium KDP can be directly obtained from the differential phase shift φDP at two different locations. Notes• KDP is only affected by anisotropic hydrometeors (rain) and therefore KDP allows to discriminate between rain and frozen precipitation. | ||
Spectral widthA measure of the dispersion of velocities within the pulse volume. Standard deviation of the velocity spectrum. Spectral width depends among others from the turbulence within the pulse volume. | |
Spectrum at Maximum VelocityDescriptionVisualisation of areas with high velocity and high spectrum width (potential risk For air traffic). No height information given. V and W must be scanned together to make this product. ParametersRangeImage size Height (top and bottom) | ||
Specular reflectionsSpecular reflections may be caused by radiowaves reflected by water surface or windows/buildings. Direction of the reflected radiowaves is determined by the incidence angle. Specular reflections may cause problems for both reflectivity and velocity measurements as the direction of the radar beam is changed. Example Image 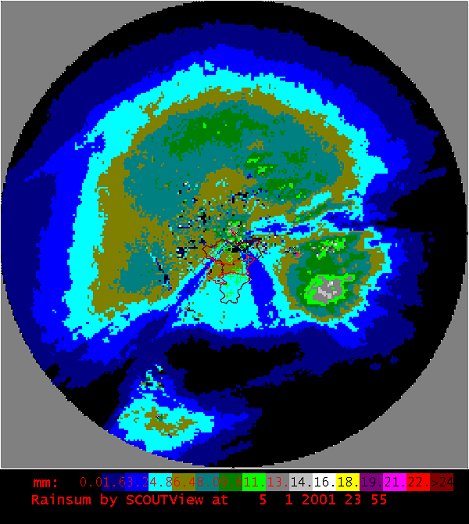 | |
Storm Relative VelocityShows local radial velocity values relative to a moving storm. Can be aplied on polar volume data of radial velocity. | ||
Suboptimal compositing algorithmsThere are several different principles of choosing the data (compositing algorithm). Problems related to cartesian products cause information loss or bias, thus quality indicator fields are necessary when calculating the optimal values of data from two or more radars. There are principles of data selection based on
All of them have some problems. Most problmetic is the approach related to averaging. Information on elevation angles and radar heights should be available to use any of these principles. One possible solution is based on generating a so called seek matrix, which is in essence a pointer table. The advantage of this method is the fast pace of getting information, but is suitable for supercomputers only due to the considerable amounts of memory required by the matrix and data. | ||
SubrefractionBending of the radar beam in the vertical which is less than under standard refractive conditions. This causes the beam to be higher than indicated, and leads to underestimation of cloud heights. | |
Sun echoProblems caused to radar productsRadar receives 5 cm microwaves from the sun, which are seen mostly when the sun is near the horizon. Thus the problem is mostly encountered in higher latitudes than elsewhere.Example Image 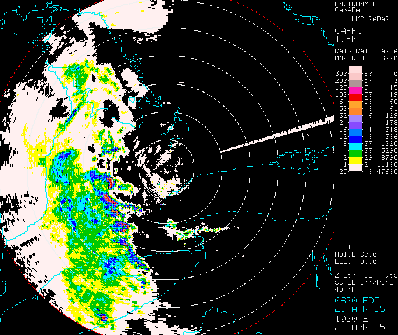 | |
SupercellA relatively long-lived storm possessing all of the following characteristics: rotation, with a high correlation between horizontal vorticity and updraft strength; existence of a BWER and/or hook echo; and a continuous mode of propagation (appears to be a steady state system). This storm type is typically associated with the most intense tornadoes and largest hailstones. | |
SuperrefractionBending of the radar beam in the vertical which is greater than under standard refractive conditions. This causes the beam to be lower than indicated, and often results in extensive ground return as well as an overestimation of cloud top heights. | |
Surface precipitation accumulationDescription2D-map with the precipitation estimates at surface level accumulated during a predefined period of time. ParametersProduct data quantity: precipitation amountImage size: number of pixels per row (# of columns) and per column (# of rows) Pixel size: horizontal and vertical extension of the pixel in km Level slicing method: list of values in 0.1 mm or formula parameters (see section 7 in WD21_99) Adjustment method: None, Radar-to-gage factors (RT or CL), Gage-tuned Z-R relationship (RT or CL), Radar-to-gage regression (LL or NL or RT or CL), Vertical profile (SY or RE) Accumulation period: in minutes Accumulation method: Sampling-and-hold or Interpolation Notes• RT: real-time,• CL: climatological, • LL: linear, • NL: non-linear, • SY: synthetic, Example Image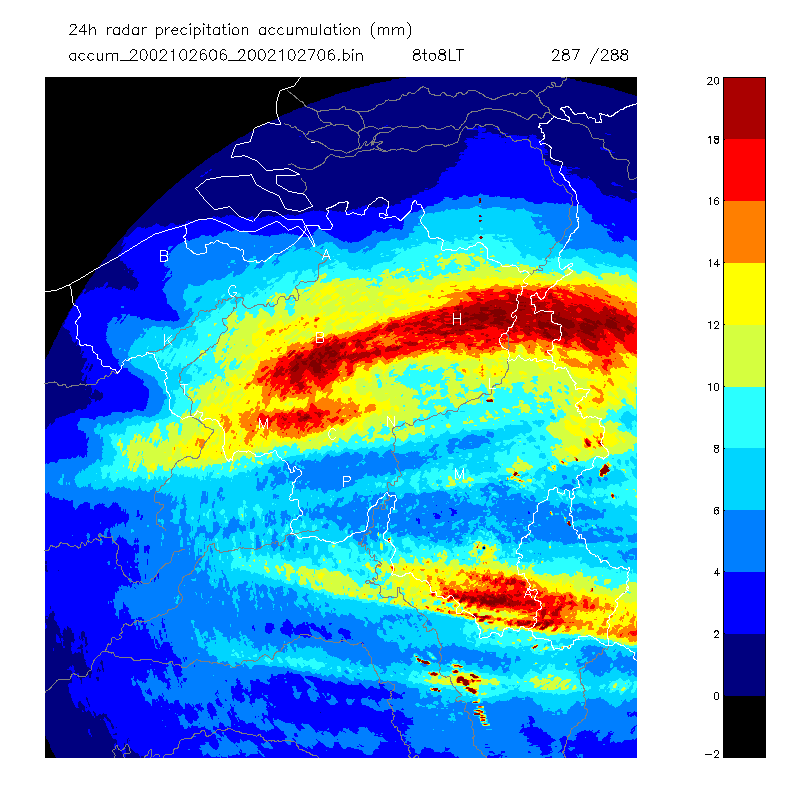 | |